Home Blog Business How to Create an Appealing Report Presentation (Guide + Templates)

How to Create an Appealing Report Presentation (Guide + Templates)

Sharing data, insights, and recommendations extracted from detailed analysis is a practice that consultants and heads of departments view as part of their everyday workload. Yet, effective communication techniques make a difference in whether the information disclosed is actionable, makes a lasting impact, or becomes critical for a decision’s outcome.
In this article, we will guide you through the process of creating a good report presentation, from general aspects to specifics by niche, recommended PowerPoint templates to use, and which aspects you should avoid in the presentation design process.
What is a Report?
What is a report presentation, business report presentations, academic report presentations, technical report presentations, sales report presentations, marketing report presentations, project report presentations, non-profit and ngo report presentations, healthcare report presentations, environmental report presentations, do’s and don’ts on a report presentation, recommended report powerpoint templates.
A report is a formal, high-level document that compiles data, research findings, and recommendations tailored to a specific topic. Its core purpose is to grant stakeholders a detailed understanding of a situation and provide background for decision-making processes.
We can define a report presentation as the visual and verbal method of communicating the key elements of a written report. Typically, report presentations happen in meeting or conference settings, where the scale of the report presentation depends on any of these three factors:
- Topic of the report presentation
- People or teams involved in the outcome of the report
- People or teams that must be aware of the information retrieved from the report
Depending on its topic, the amount of slides or specific slide design to include, which we shall mention in the upcoming section.
Types of Report Presentations
Business report presentations focus on a business’s performance, strategy, and operations, conveying important information to stakeholders for decision-making purposes. These presentation slides are used during board meetings, business plan presentations , quarterly reviews, strategic planning sessions, and investor meetings.

A typical business report presentation should contain the following slides on its slide deck:
- Title Slide : Title, presenter’s name, date, and company logo.
- Agenda Slide : Outline of main sections.
- Executive Summary Slide : Key takeaways and highlights.
- Financial Overview Slide : Revenue, expenses, profit, and loss.
- Performance Metrics Slide : Key performance indicators (KPIs).
- Strategic Initiatives Slide: Current and future projects.
- Market Analysis Slide : Market trends and competitive analysis.
- SWOT Analysis Slide: Strengths, weaknesses, opportunities, and threats.
- Recommendations Slide : Suggested actions and next steps.
- Q&A Slide : Invite questions from the audience.
- Conclusion Slide : Summary of key points.
Presenters must generally focus on clearly expressing the key points and insights, using charts and graphs to illustrate their findings easily. Opt for a SWOT analysis PowerPoint template to simply the SWOT representation process.
Academic report presentations communicate research findings, project outcomes, and scholarly work to academic peers and professionals. They are common at academic conferences, seminars, workshops, and in classrooms (post-graduate settings).

To build a high-quality academic report presentation, consider the following slides:
- Title Slide: Title, author’s name, institution, and date.
- Introduction Slide: Background and research question.
- Literature Review Slide: Summary of relevant research.
- Methodology Slide : Research methods and design.
- Data Slide: Key data and statistics.
- Analysis Slide: Interpretation of data.
- Results Slide: Main findings.
- Discussion Slide : Implications and significance.
- Conclusion Slide: Summary of findings and future research directions.
- References Slide: List of sources and citations.
- Q&A Slide
Avoid jargon at all costs unless specifically required by your tutor. Aiming to create an interactive presentation out of it can be a plus.
Technical report presentations detail technical data, research findings, and project updates (i.e., project status report templates ) to a specialized audience, often in fields like engineering, IT, and science. They are used in technical meetings, conferences, project updates, and during product development cycles.

The slides a technical report presentation should include are:
- Title Slide
- Problem Statement Slide: Definition and scope of the problem.
- Objectives Slide: Goals of the technical work.
- Methodology Slide: Technical approach and procedures.
- Data Slide: Key data points and measurements.
- Analysis Slide: Interpretation of technical data.
- Results Slide: Main findings and outcomes.
- Technical Challenges Slide: Issues encountered and solutions.
- Recommendations Slide: Suggested actions based on findings.
- Future Work Slide: Next steps or future research.
- Conclusion Slide
Diagrams, infographics, and graphs are handy for explaining complex data. Presenters should encourage the audience to ask questions about the topic and break down the complex elements into easy-to-understand chunks of information.
Sales report presentations provide insights into sales performance, trends, and forecasts to understand market conditions and sales strategies . Presenters who are looking how to make a presentation in the sales niche can apply it for sales meetings, quarterly reviews, strategy sessions, and performance evaluations.

A successful sales report presentation features the following slides on its deck:
- Agenda Slide
- Sales Performance Slide: Sales figures and trends.
- Target vs Actual Slide: Comparison of targets and actual sales.
- Sales by Region/Product Slide: Breakdown of sales data.
- Sales Pipeline Slide: Status of sales leads and opportunities.
- Customer Insights Slide: Key customer trends and feedback.
- Competitor Analysis Slide: Competitive landscape.
- Strategies Slide: Current and future sales strategies.
- Recommendations Slide: Suggested improvements and actions.
As a recommendation, in our experience, it’s a good practice to include a sales dashboard slide highlighting the key sale metrics. It would be beneficial if a new sales strategy were implemented and the team wanted to extract conclusive data from it.
Marketing report presentations analyze marketing campaigns, strategies, and performance metrics to assess the impact and plan future initiatives. We can come across this kind of report and presentation in situations like marketing meetings, marketing plan presentations , campaign reviews, strategy sessions, and performance evaluations.

Consider to list the following slides to create an effective marketing report presentation:
- Campaign Overview Slide: Summary of marketing campaigns.
- Performance Metrics Slide: Key metrics like ROI, conversion rates, and engagement.
- Audience Insights Slide: Data on target demographics and customer behavior.
- Channel Performance Slide: Performance by marketing channel (e.g., social media, email).
- Competitor Analysis Slide: Competitive landscape and benchmarking.
- Strategies Slide: Current and future marketing strategies.
This is a type of report presentation where you should encourage audience participation due to the importance of the creativity factor in new campaigns. Use infographics to represent dense groups of data related to social media reports . Strategy presentation templates are also a good fit to enhance your report presentation slide deck.
Additionally, we include on this following link a Free Social Media Report PowerPoint template for users to create professional-looking slides in seconds.
Project report presentations detail project progress, challenges, and outcomes, providing updates to stakeholders and ensuring alignment with goals. Typical use cases of these report presentations are project meetings, status updates, and post-project reviews.

To create a slide deck for project report presentations, consider to include these slides:
- Title Slide: Title, presenter’s name, date, and project name.
- Project Overview Slide: Summary of project goals and scope.
- Timeline Slide: Key milestones and project schedule.
- Progress Slide: Status of project phases and tasks.
- Challenges Slide: Issues encountered and mitigation strategies.
- Budget Slide: Financial status and budget adherence.
- Risk Management Slide: Identified risks and their management.
- Next Steps Slide: Upcoming tasks and milestones.
Gantt charts , progress bars , and budget graphs are excellent presentation tools for showcasing key information in project presentations . Be sure to include the exact dates for project updates.
Non-profit and NGO report presentations highlight the organization’s activities, achievements, and financial status, communicating with donors, volunteers, and the public. They are a key element of transparency in relationships with the public and donors, and they are used in board meetings, fundraising events, annual reviews, and community outreach.

To create this kind of report presentation, we need to include these slides:
- Mission Slide: Organization’s mission and goals.
- Activities Slide: Summary of recent activities and programs.
- Impact Slide: Data on the impact and outcomes of programs.
- Financial Overview Slide: Income, expenses, and budget status.
- Donor Recognition Slide: Acknowledgment of key donors and supporters.
- Challenges Slide: Issues faced and solutions implemented.
- Future Plans Slide: Upcoming projects and initiatives.
Harness the power of storytelling . Include success stories, impact charts, infographics, and program photos. Highlight the outcomes and benefits this organization has brought to its target community. Annual Report PowerPoint templates can speed up the design creation phase of your report presentation.
Healthcare report presentations provide data on patient outcomes, research findings, and healthcare initiatives aimed at improving medical practices and policies. They are used in medical conferences, healthcare meetings, research symposiums, and policy briefings.

The slides we must count on for building an effective healthcare report presentation are:
- Background Slide: Context and objectives of the report.
- Methodology Slide: Research methods and data collection.
- Data Slide: Key statistics and findings.
- Analysis Slide: Interpretation of data and implications.
- Recommendations Slide: Suggested actions or policy changes.
- Future Research Slide: Areas for further investigation.
If you need to share a patient’s data concerning a newly developed technique or as findings from research, be sure you are authorized to disclose that information.
Finally, environmental report presentations focus on environmental research, sustainability projects, and ecological impact assessments to inform stakeholders and promote environmental protection. We can attend these kinds of presentations at ecological conferences, policy briefings, project reviews, and community meetings.

Include the following slides in your deck to create an outstanding environmental report presentation:
- Impact Slide: Environmental impact and sustainability metrics.
- Recommendations Slide: Suggested actions and policy changes.
Video presentations are ideal for adding an extra emotional factor and connecting with the audience about the importance of environmental causes, and they are also applicable to any kind of consulting report . Another key approach is to include testimonials from well-accredited sources or individuals affected by the environmental factor.
- Do start with a clear objective.
- Do use visuals to support your message.
- Do practice how to start your presentation .
- Do engage with your audience by asking questions and inviting feedback.
- Do end your presentation with powerful graphics
- Don’t overload slides with text.
- Don’t ignore your audience’s needs and interests.
- Don’t rush through the presentation.
- Don’t rely solely on the slides; use them to complement your speech.
How long should a report presentation be?
The length depends on the context and audience, but 15-30 minutes is a standard time for most report presentations.
What tools can I use to create a report presentation?
Common tools include PowerPoint, Google Slides templates , and Keynote. Specialized data visualization tools like Tableau can also be useful.
How can I make my report presentation more engaging?
Use storytelling techniques, interactive elements, and visual aids to engage your audience .
Should I distribute copies of the report?
It’s often a good idea to provide copies or a summary handout for the audience to follow along and refer to after the presentation.
In this section, you can find a list of curated report presentation slides to make your work easier. You can work with any of these designs or opt to use the ones presented above.
1. Expense Report Presentation Slide
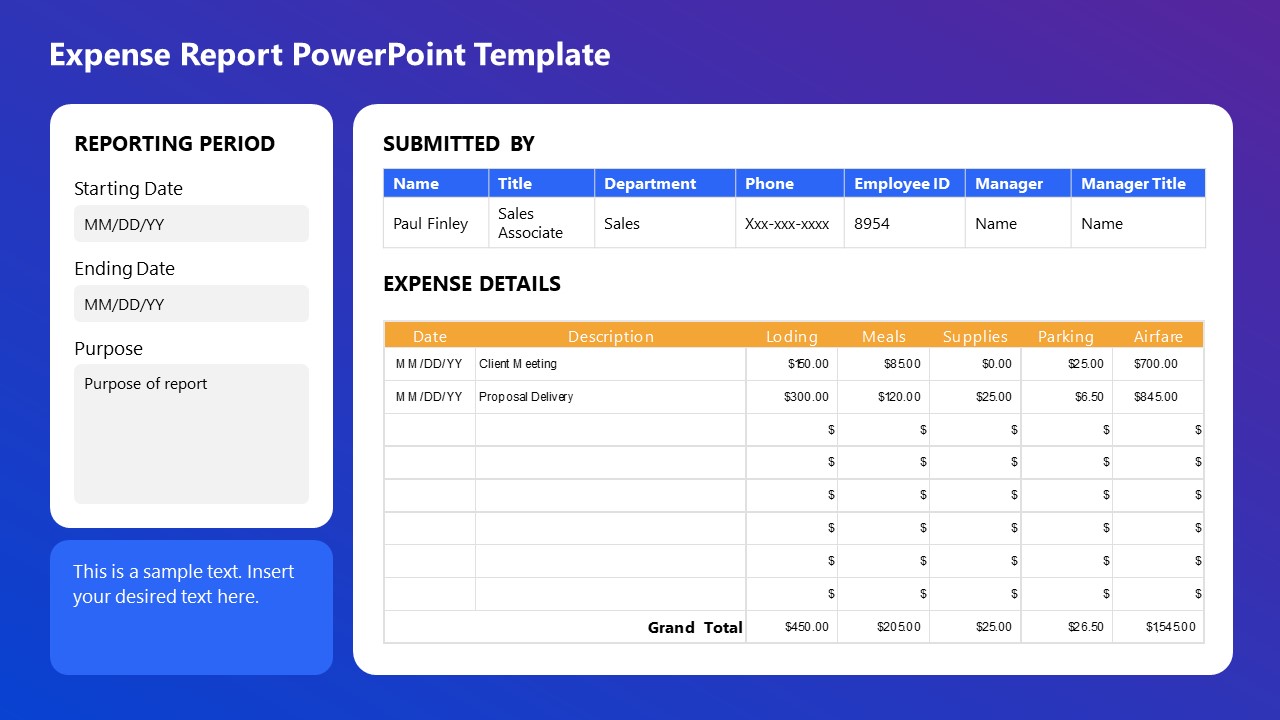
This Expense Report PowerPoint Template is perfect for detailed financial presentations. Easily document and display expenses, including lodging, meals, supplies, parking, and airfare, with clear sections for reporting periods, submission details, and expense descriptions. Ideal for corporate reporting, budget reviews, and financial audits, ensuring organized and professional presentations.
Use This Template
2. Business Progress Report Slides for PowerPoint

This Business Progress Report Template is designed to track project milestones and performance metrics. Listing a profile section for team members and a color-coded progress indicator allows for clear visualization of project status. It is ideal for team meetings, stakeholder updates, and performance reviews, ensuring a concise and effective presentation.
3. Book Report Presentation Slide Deck for PowerPoint
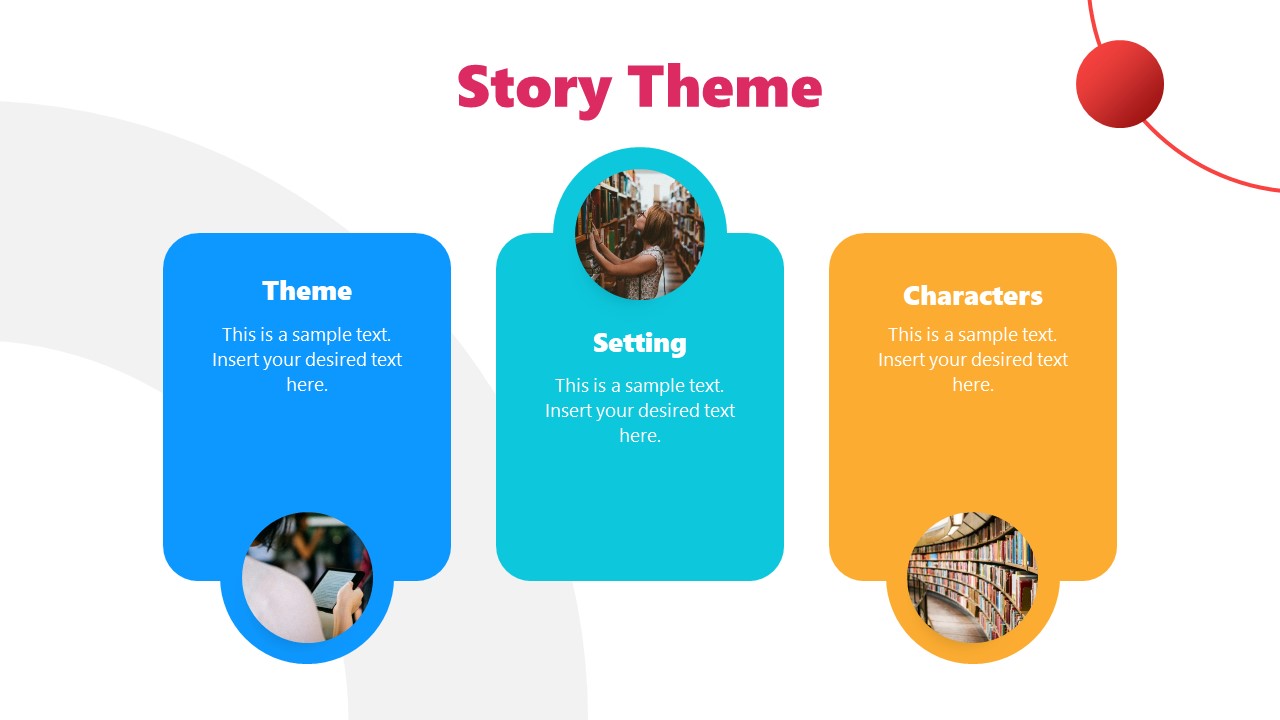
This Book Report PPT template is ideal for structuring narrative elements in presentations. We can outline a story’s theme, setting, and characters with visual aids to enhance understanding. This template is perfect for writers, educators, and marketers to convey story concepts effectively, ensuring a cohesive and engaging presentation.
4. Annual Report Template for PowerPoint
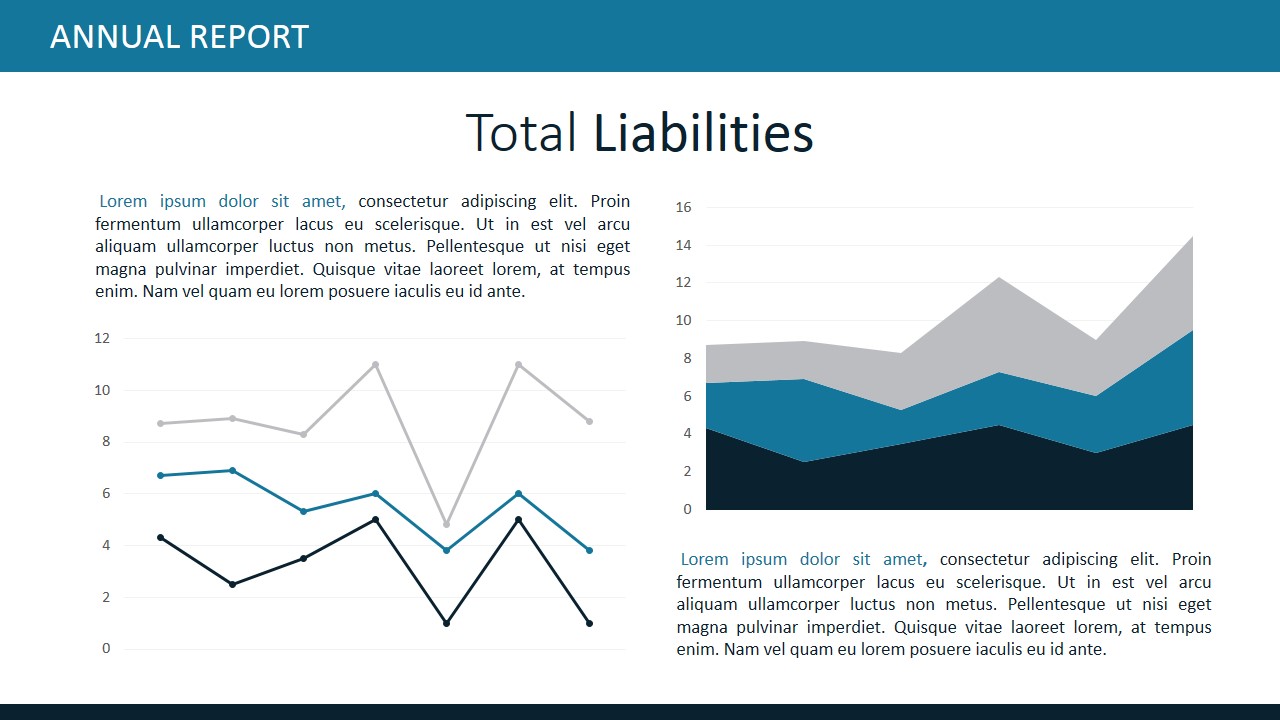
This Annual Report slide deck is designed for clear financial analysis. It features sections for detailed descriptions, bar charts, and pie charts to represent expense data visually. Perfect for financial reviews, investor presentations, and budget meetings, this template ensures a comprehensive and professional overview of total expenses, facilitating informed decision-making.
5. Business Annual Report PowerPoint Template
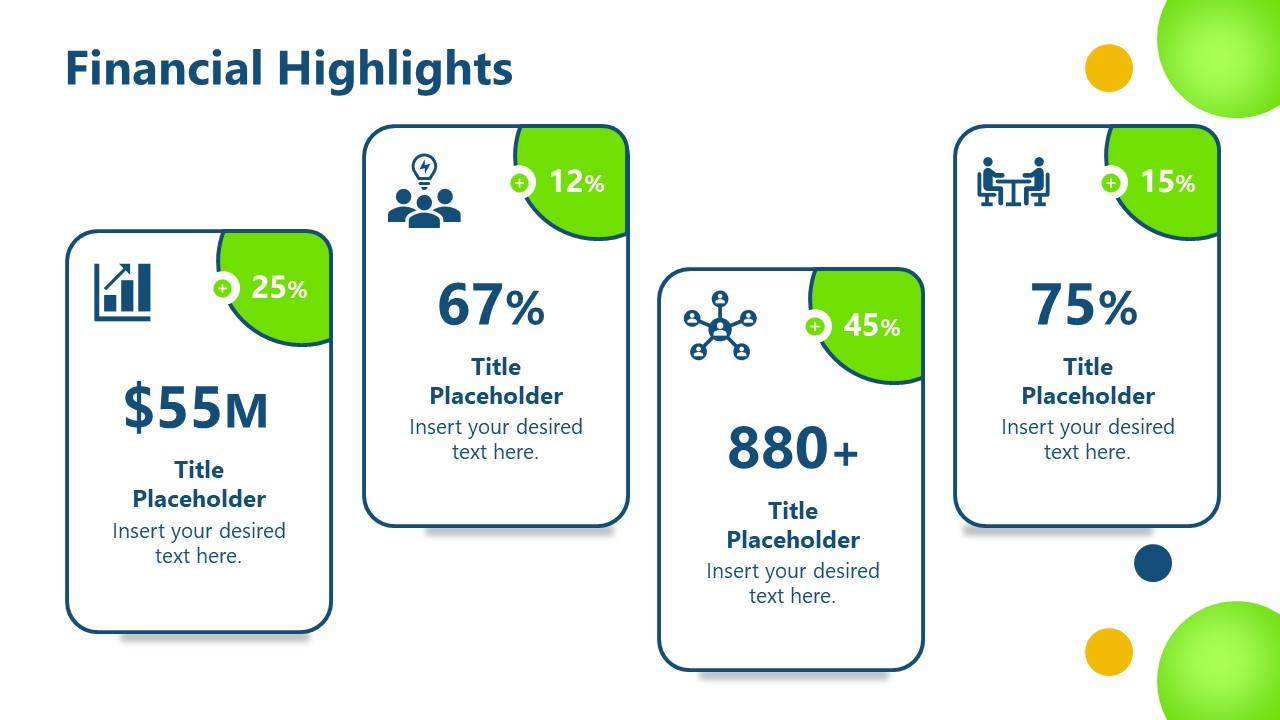
A slide deck designed to showcase key financial metrics and achievements. We include sections for displaying significant figures, percentages, and growth indicators, making it perfect for annual reports, investor meetings, and financial reviews. With clear and visually appealing graphics, this template ensures a concise and impactful presentation of financial performance highlights.
6. Financial Dashboard Report Template for PowerPoint
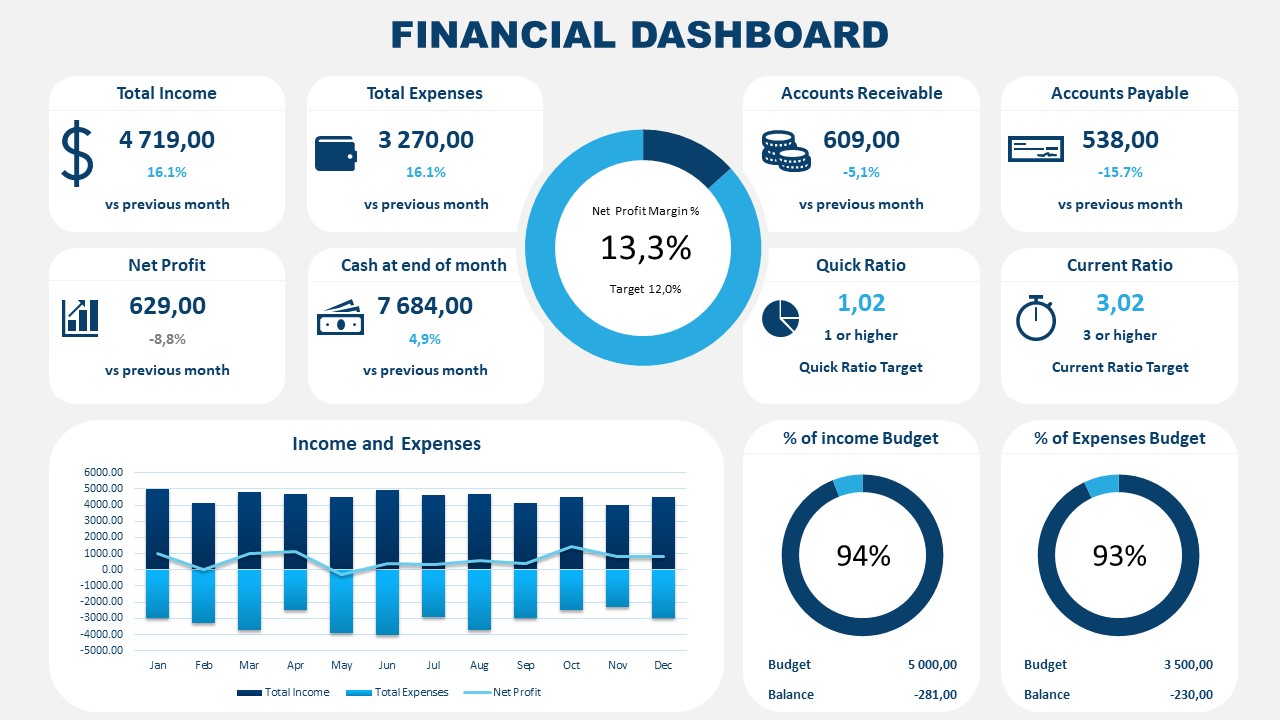
Accurately represent financial information that’s critical for your organization by implementing this PPT report template. It is a data-driven layout containing different boxes to showcase KPIs; managers and team leaders can use this template to align organizational efforts toward a strategic goal.
Like this article? Please share
Consumer Reports, Design, Executive Reports, Financial Report Filed under Business
Related Articles

Filed under Google Slides Tutorials • July 16th, 2024
How to Make a Google Slides Presentation Look Good
Polish your presentation slides with these 10 tips by design professionals. Learn how to make Google Slides look good now!
Filed under Google Slides Tutorials • July 6th, 2024
How to Insert Icons in Google Slides
Learn how to insert icons in Google Slides and customize your slide design for maximum audience engagement.

Filed under PowerPoint Tutorials • July 4th, 2024
How to Change Slide Dimensions in PowerPoint
Get to know how to change slide dimensions in PowerPoint to create custom designs with this guide.
Leave a Reply
- Collections
- Sales Report
Free Sales Report Presentation Templates
Turn bland sales reports into captivating presentations with free sales report powerpoint templates and google slides themes. impress bosses, wow clients, and motivate your team with creative visuals, editable charts, and easy-to-understand layouts. grab attention, secure funding, and crush goals - all without design headaches. get started for free.

- Simple Sales Report: Perfect for a quick overview, these sales data presentation templates get straight to the point with clear visuals and concise data summaries.
- Sales Performance Dashboard : Track your progress with interactive charts and graphs that showcase your team's wins and areas for improvement.
- Sales Portfolio : Highlight your most successful projects and showcase the value you bring to your clients.
- Finance: Present your revenue, budgets, and ROI clearly and effectively.
- Sales managers: Impress your boss and secure that promotion with a data-driven report that showcases your team's brilliance.
- Marketing teams: Align your sales efforts with your marketing strategy using templates that tell the story of your customer journey.
- Business owners: Secure funding, attract new investors, and make informed decisions with presentations that leave a lasting impression.
- Team meetings: Keep your team informed and motivated with clear, concise presentations.
- Client meetings: Impress potential clients and secure new deals with professional, data-driven presentations.
- Industry events: Share your insights and expertise with a wider audience using engaging and informative slides.
We're here to help you!
Where can i find free sales report templates.
Slide Egg offers a huge library of free sales report PowerPoint and Google Slides themes. Simply browse the category and download your favorites!
Do I need any special design skills to use these templates?
Absolutely not! Our templates are designed for everyone, regardless of design experience. Simply edit the text, charts, and colors to match your data and brand.
What types of sales reports can I create with these templates?
Our selection covers a wide range, from simple summaries to detailed forecasts, portfolio showcases, and performance dashboards. Find the perfect template to match your specific needs.
Can I customize the templates?
Yes, you can! All elements are fully editable, including text, charts, graphics, and colors. Make the templates your own and tell your unique story.
Are these templates compatible with PowerPoint and Google Slides?
Yes! Our templates are available in both PowerPoint and Google Slides formats, so you can choose your preferred platform.
Can I add my company logo and branding to the templates?
Of course! Add your logo, colors, and fonts to personalize the templates and match your brand identity.
How can I make my sales report presentation stand out?
Using high-quality visuals, clear storytelling, and concise data presentation is key. Explore our creative slide layouts, editable charts, and infographic elements to add visual interest.
Can I share my presentation with others?
Yes, you can share your finished presentation with others, either offline or online, depending on your chosen platform.
We use essential cookies to make Venngage work. By clicking “Accept All Cookies”, you agree to the storing of cookies on your device to enhance site navigation, analyze site usage, and assist in our marketing efforts.
Manage Cookies
Cookies and similar technologies collect certain information about how you’re using our website. Some of them are essential, and without them you wouldn’t be able to use Venngage. But others are optional, and you get to choose whether we use them or not.
Strictly Necessary Cookies
These cookies are always on, as they’re essential for making Venngage work, and making it safe. Without these cookies, services you’ve asked for can’t be provided.
Show cookie providers
- Google Login
Functionality Cookies
These cookies help us provide enhanced functionality and personalisation, and remember your settings. They may be set by us or by third party providers.
Performance Cookies
These cookies help us analyze how many people are using Venngage, where they come from and how they're using it. If you opt out of these cookies, we can’t get feedback to make Venngage better for you and all our users.
- Google Analytics
Targeting Cookies
These cookies are set by our advertising partners to track your activity and show you relevant Venngage ads on other sites as you browse the internet.
- Google Tag Manager
- Infographics
- Daily Infographics
- Popular Templates
- Accessibility
- Graphic Design
- Graphs and Charts
- Data Visualization
- Human Resources
- Beginner Guides
Blog Marketing 15 Sales Presentation Examples to Drive Sales
15 Sales Presentation Examples to Drive Sales
Written by: Danesh Ramuthi Oct 31, 2023

A sales presentation is not merely a brief introduction to a product or service. It’s a meticulously constructed sales pitch tailored to showcase the unique features and key elements of what’s being offered and to resonate deeply with the prospective customers.
But what stands out in the best sales presentation is their ability to weave an engaging story, integrating customer testimonials, success stories and sales performances to maintain the audience’s attention span and to persuade them to take action.
The right tools, like those provided by Venngage presentation Maker and its sales presentation templates , can greatly aid in this endeavor. The aim is to have a presentation memorable enough that it lingers in the minds of potential clients long after the pitch.
Its ultimate aim is not just to inform but to persuasively secure the audience’s commitment.
Click to jump ahead:
6 Sales presentation examples
What to include and how to create a sales presentation, sales presentation vs pitch deck.
- Final thoughts
A sales presentation can be the differentiating factor that turns a potential client into a loyal customer. The manner in which a brand or individual presents their value proposition, product, or service can significantly impact the buying decisions of their audience.
Hence, drawing inspiration from various sales presentation examples can be an instrumental step in crafting the perfect pitch.
Let’s explore a few examples of sales presentations that cater to different needs and can be highly effective when used in the right context.
Clean sales presentation examples
The concept of a “clean” sales presentation reflects more than just its visual aesthetic; it captures an ethos of straightforward, concise and effective communication. A clean presentation offers a professional and efficient way to present your sales pitch, making it especially favorable for brands or individuals looking to be perceived as trustworthy and reliable.
Every slide in such a presentation is meticulously designed to be aesthetically pleasing, balancing visuals and text in a manner that complements rather than competes.

Its visual appeal is undeniably a draw, but the real power of a clean sales presentation lies in its ability to be engaging enough to hold your audience’s attention. By minimizing distractions, the message you’re trying to convey becomes the focal point. This ensures that your audience remains engaged, absorbing the key points without being overwhelmed.
A clean design also lends itself well to integrating various elements such as graphs, charts and images, ensuring they’re presented in a clear and cohesive manner. In a business environment where attention spans are continually challenged, a clean presentation stands as an oasis of clarity, ensuring that your audience walks away with a clear understanding of what you offer and why it matters to them.

Minimalist sales presentation examples
Minimalism, as a design and communication philosophy, revolves around the principle of ‘less is more’. It’s a bold statement in restraint and purpose. In the context of sales presentations, a minimalist approach can be incredibly powerful.

It ensures that your content, stripped of any unnecessary embellishments, remains at the forefront. The primary objective is to let the core message shine, ensuring that every slide, every graphic and every word serves a precise purpose.

This design aesthetic brings with it a sense of sophistication and crispness that can be a potent tool in capturing your audience’s attention. There’s an inherent elegance in simplicity which can elevate your presentation, making it memorable.

But beyond just the visual appeal, the minimalist design is strategic. With fewer elements on a slide, the audience can focus more intently on the message, leading to better retention and engagement. It’s a brilliant way to ensure that your message doesn’t just reach your audience, but truly resonates with them.
Every slide is crafted to ensure that the audience’s focus never wavers from the central narrative, making it an excellent choice for brands or individuals seeking to create a profound impact with their pitches.

Simple sales presentation examples
A simple sales presentation provides a clear and unobstructed pathway to your main message, ensuring that the audience’s focus remains undivided. Perfect for highlighting key information, it ensures that your products or services are front and center, unobscured by excessive design elements or verbose content.

But the beauty of a simple design is in its flexibility. With platforms like Venngage , you have the freedom to customize it according to your brand voice and identity. Whether it’s adjusting text sizes, incorporating vibrant colors or selecting standout photos or icons from expansive free stock libraries, the power to enhance and personalize your presentation lies at your fingertips.
Creating your ideal design becomes a seamless process, ensuring that while the presentation remains simple, it is every bit as effective and captivating.
Professional sales presentation example
A professional sales presentation is meticulously crafted, reflecting the brand’s guidelines, voice and core values. It goes beyond just key features or product benefits; it encapsulates the brand’s ethos, presenting a cohesive narrative that resonates deeply with its target audience.

For sales professionals, it’s more than just a slide deck; it’s an embodiment of the brand’s identity, from the great cover image to the clear call to action at its conclusion.
These presentations are tailored to address potential pain points, include sales performances, and present solutions in a compelling and engaging story format.

Integrating elements like customer success stories and key insights, ensuring that the presentation is not just good, but memorable.

Sales performance sales presentation example
A company’s sales performance presentation is vital to evaluate, refine and boost their sales process. It’s more than just numbers on a slide deck; it’s a comprehensive look into the effectiveness of sales campaigns, strategies and the sales team as a whole.

This type of sales presentation provides key insights into what’s working, what isn’t and where there’s potential for growth.
It’s an invaluable tool for sales professionals, often serving as a roadmap guiding future sales pitches and marketing campaigns.

An effective sales performance presentation might begin with a compelling cover slide, reflecting the brand’s identity, followed by a brief introduction to set the context. From there, it delves into specifics: from the sales metrics, customer feedback and more.
Ultimately, this presentation is a call to action for the sales team, ensuring they are equipped with the best tools, strategies and knowledge to convert prospective customers into paying ones, driving more deals and growing the business.

Testimonial-based sales presentation examples
Leveraging the voices of satisfied customers, a testimonial-based sales presentation seamlessly blends social proof with the brand’s value proposition. It’s a testament to the real-world impact of a product or service, often making it one of the most effective sales presentation examples.

By centering on customer testimonials, it taps into the compelling stories of those who have experienced firsthand the benefits of what’s being offered.
As the presentation unfolds, the audience is introduced to various customer’s stories, each underscoring the product’s unique features or addressing potential pain points.

These success stories serve dual purposes: they not only captivate the audience’s attention but also preemptively handle sales objections by showcasing how other customers overcame similar challenges.
Sales professionals can further augment the presentation with key insights derived from these testimonials, tailoring their sales pitch to resonate deeply with their potential clients.
Creating a good sales presentation is like putting together a puzzle. Each piece needs to fit just right for the whole picture to make sense.
So, what are these pieces and how do you put them together?
Here, I’ll break down the must-have parts of a sales presentation and give you simple steps to build one.
What to include in a sales presentation?
With so much information to convey and a limited time to engage your audience in your sales presentation, where do you start?
Here, we’re going to explore the essential components of a successful sales presentation, ensuring you craft a compelling narrative that resonates with your prospects.
- A captivating opening slide: First impressions matter. Start with a great cover image or slide that grabs your audience’s attention instantly. Your opening should set the tone, making prospects curious about what’s to come.
- Data-driven slides: Incorporate key points using charts, graphs, infographics and quotes. Instead of flooding your slides with redundant information, use them as a tool to visually represent data. Metrics from your sales dashboard or third-party sources can be particularly illuminating.
- Social proof through testimonials: Weave in testimonials and case studies from satisfied customers. These success stories, especially from those in the same industry as your prospects, act as powerful endorsements, bolstering the credibility of your claims.
- Competitive context: Being proactive is the hallmark of savvy sales professionals. Address how your product or service fares against competitors, presenting a comparative analysis.
- Customized content: While using a foundational slide deck can be helpful, personalizing your presentation for each meeting can make all the difference. Whether it’s integrating the prospect’s brand colors, industry-specific data or referencing a past interaction, tailored content makes your audience feel acknowledged.
- Clear path to the future: End by offering a glimpse into the next steps. This can include a direct call to action or an overview of the onboarding process. Highlight the unique value your company brings post-sale, such as exceptional training or standout customer support.
- Keep it simple: Remember, simplicity is key. Avoid overcrowding your slides with excessive text. Visual data should take center stage, aiding in comprehension and retention.
Related: 120+ Presentation Ideas, Topics & Example
How to create a sales presentation?
Crafting a good sales presentation is an art that blends structure, content and design.
A successful sales presentation not only tells but also sells, capturing the audience’s attention while conveying the main message effectively.
Here’s a step-by-step guide to ensure that your sales deck becomes a winning sales presentation.
1. Find out your ideal audience
The first step to any effective sales pitch is understanding your audience. Are you presenting to prospective customers, potential clients or an internet marketing agency? Recognize their pain points, buying process and interests to craft a message that resonates. This understanding ensures that your presentation is memorable and speaks directly to their unique needs.
2. Pick a platform to Use
Depending on your target audience and the complexity of your sales literature, you might opt for Venngage presentation maker, PowerPoint templates, Google Slides or any tools that you are comfortable with. Choose a tool that complements your brand identity and aids in keeping your audience’s attention span engaged.
3. Write the ‘About Us’ section
Here’s where you build trust. Give a brief introduction about your organization, its values and achievements. Highlight key elements that set you apart, be it a compelling story of your brand’s inception, a lucrative deal you managed to seal, or an instance where an internet marketing agency hired you for their needs.
4. Present facts and data
Dive deep into sales performance metrics, client satisfaction scores and feedback. Use charts, graphs and infographics to visually represent these facts. Testimonials and customer success stories provide that added layer of social proof. By showcasing concrete examples, like a customer’s story or feedback, you give your audience solid reasons to trust your product or service.
5. Finish with a memorable conclusion & CTA
Now that you’ve laid out all the information, conclude with a bang. Reiterate the value proposition and key insights you want your audience to remember. Perhaps share a compelling marketing campaign or a unique feature of your offering.
End with a clear call to action, directing your prospects on what to do next, whether it’s downloading further assistance material, getting in touch for more deals or moving further down the sales funnel .
Related: 8 Types of Presentations You Should Know [+Examples & Tips]
Sales presentation and the pitch deck may seem similar at first glance but their goals, focuses, and best-use scenarios differ considerably. Here’s a succinct breakdown of the two:
Sales Presentation:
- What is it? An in-depth dialogue designed to persuade potential clients to make a purchase.
- Focuses on: Brand identity, social proof, detailed product features, addressing customer pain points, and guiding to the buying process.
- Best for: Detailed interactions, longer meetings and thorough discussions with potential customers.
- Example: A sales rep detailing a marketing campaign to a potential client.
Pitch Deck:
- What is it? Pitch deck is a presentation to help potential investors learn more about your business. The main goal isn’t to secure funding but to pique interest for a follow-up meeting.
- Focuses on: Brand voice, key features, growth potential and an intriguing idea that captures the investor’s interest.
- Best for: Initial investor meetings, quick pitches, showcasing company potential.
- Example: A startup introducing its unique value proposition and growth trajectory to prospective investors.
Shared traits: Both aim to create interest and engagement with the audience. The primary difference lies in the intent and the audience: one is for selling a product/service and the other is for igniting investor interest.
Related: How to Create an Effective Pitch Deck Design [+Examples]
Final thoughts
Sales presentations are the heart and soul of many businesses. They are the bridge between a potential customer’s needs and the solution your product or service offers. The examples provided—from clean, minimalist to professional styles—offer a spectrum of how you can approach your next sales presentation.
Remember, it’s not just about the aesthetics or the data; it’s about the narrative, the story you tell, and the connection you establish. And while sales presentations and pitch decks have their distinct purposes, the objective remains consistent: to engage, persuade and drive action.
If you’re gearing up for your next sales presentation, don’t start from scratch. Utilize Venngage presentation Maker and explore our comprehensive collection of sales presentation templates .
Discover popular designs

Infographic maker

Brochure maker

White paper online

Newsletter creator

Flyer maker

Timeline maker

Letterhead maker

Mind map maker

Ebook maker
No results found.
Sales presentations: templates, examples and ideas on how to present like a pro

A good sales presentation is more than a simple pitch, a demo or a list of facts and figures. Done well, at the right time in your sales process , it’s a tool for getting your prospects’ attention, drumming up excitement and moving prospects toward a buying decision.
In this guide, you’ll learn how to use the power of storytelling to drive decision-making and close more deals. We’ll also cover the fundamental elements of an effective sales presentation strategy, what to include in your sales decks and practical ideas on how to deliver them.
What is a sales presentation?
A sales presentation is a live meeting where your team showcases your product or service and why it’s the best option for your prospect.
Although the terminology differs from company to company, a sales presentation is not always the same as a sales pitch.
A sales pitch is what your sales professionals do all day long, on the phone, over Zoom or in person with clients.
A sales presentation (although it’s still a sales pitch) is a point-in-time event that usually happens when your sales team is trying to close a more lucrative deal. It’s not a simple phone call, as it often involves a meeting and a demo.
Because you’re likely presenting to a group of senior decision-makers and executives, sales presentations require ample prep time and coordination across multiple team members.
Key takeaways from this sales presentations article
Deliver effective presentations: Make your sales presentations compelling with storytelling, effective slide decks, tailored content and strong delivery techniques. Benefits of great presentations: Sales presentations grab attention, excite prospects and drive decision-making, helping close more deals by showcasing your product’s value. Pipedrive’s tools, including customizable sales dashboards and Smart Docs , help you create professional, tailored presentations that enhance your sales strategy. Try Pipedrive free for 14 days .
How (and why) to use storytelling in your sales presentation
Use stories in your presentations to help people remember and relate to your brand.
Statistics, facts and figures can help when you’re trying to persuade a prospect to become a customer, but they’re more impactful if you can frame them with a memorable story.
For example, tell a story about a customer who faced the same challenges as your prospect and supplement it with powerful data, they are more likely to listen and want to know more.
Human beings have a deep relationship with storytelling. Stories move, teach and, in a sales context, persuade audiences.
Chip Heath, a Stanford professor and the co-author of Made to Stick , demonstrates the importance of storytelling by doing an exercise with his students. He divides them into groups and asks them to deliver a one-minute persuasive pitch based on data he’s just shown them.
After the pitches are delivered, he asks the class to jot down everything they remember about them. Although most students use stats rather than stories, 63% remember the stories, while only 5% remember an individual data point .
The stickiness of stories makes them a useful tool for developing a sales presentation outline. They help prospects understand and remember the key points of the presentation and your product.
Thomas Dredge Sales Manager, Particular Audience
Start with a problem (and a deadline)
Your presentation is about the solution you’re offering your prospects, but it shouldn’t start with that solution.
Instead, lead with the problem your solution was designed to solve.
“ Value selling is key,” says Bradley Davies, business development at Cognism . “It is important to understand your buyer and tailor their journey to what you can do for them.
“First, you need to understand what is motivating them to have a discussion, which allows you to identify their pains and present how your offering solves their pains. Everything presented to a prospect should be based on the value for them specifically.”
You might choose to tell a story that positions your product as the hero, helping the customer vanquish a villain: their pain point.
Your story should be tailored to the pain points of the prospects in the room. For example, a change to their business, industry or the technology they use.
“If an element of your offering is not relevant, then don't distract them from the important features. It will keep them engaged and help to build their user story,” adds Bradley.
Recommended reading

Digging deep to determine customer pain points and make the sale
Create a sense of urgency around your product: It’s a solution to their problem, but if they don’t act now, they could miss an opportunity. Tell a story about what might happen if your prospect doesn’t change, framing the consequences of inaction.
Focus on outcomes
You’ve outlined the problem and, if you’re doing your job, your audience is nodding along. Now it’s time to start talking about the solution.
However, that doesn’t mean you should launch into the features and benefits of your product just yet.
Rather than presenting your product, a good sales presentation draws a picture of what life could look like for a customer once they start doing things differently. How will their workload or productivity improve? What will they be able to do with additional time and resources? How will they reduce spending and increase revenue?
From there, introduce your solution and the features that can make this brave new world possible. Do this in a few ways:
Position your features against the old way of doing things
Present those features as “superpowers” that will solve your prospect’s problems
Compare those features to competitors’ features
Quantify the value your features bring vs. the cost of doing nothing
Use a combination of some or all of the above
Creating a winning sales presentation slide deck
Most sales presentations include a slide deck to deliver facts, case studies and statistics that convey the value of your solution.
Create your sales pitch deck in an application like PowerPoint or Google slides to ensure your presentation is visible to everyone in the room (or in a virtual setting).
The best sales decks have a few key elements:
A great cover image or opening slide. Like the story you open your presentation with, your cover slide should grab your audience’s attention.
Data and key points . Charts, graphs, infographics, quotes and other information back up your presentation. Your slides should support your presentation by visualizing data, not repeating what you’re saying. You can get metrics from third-party sources or (if appropriate) from your own sales dashboard .
Testimonials and case studies from other customers. Quotes and success stories from or information about other customers, preferably in the same industry as your prospects, will act as social proof and go a long way to backing up your claims.
Competitive context. In all likelihood, your product isn’t the only one a potential customer is evaluating. Savvy sales professionals take the opportunity to proactively communicate how their product stacks up to their competitors’ and anticipate objections.
Customized content. While it might seem tempting to use the same content for every presentation, you should personalize your presentation for each meeting. You might want to use your prospect’s brand colors, find data specific to their market or industry, or reference an earlier exchange. You can find ready-to-use customizable sales decks through a graphic design app, such as Canva.
A glimpse into next steps. Give your prospects an understanding of what new customer onboarding looks like with a slide that includes a direct call to action offering next steps. For some companies, the training and customer support experience can be a value proposition in and of itself.
A note about text in your sales deck : Keep the slides simple and light on text. Your prospects don’t want to look at a wall of words to read. According to data from Venngage , 84% of presenters use visual data in their presentations – and for good reason: You don’t want to overwhelm your audience with text as they listen to you, look at your sales deck and watch the demo.
When you do include text, ensure you use a font (and font size) that can be easily read by everyone sitting in on your presentation.
Download the Sales Presentation Templates ebook
Your data is processed according to our privacy notice . You may unsubscribe at any time.
What else to bring to your sales presentation
Now that we’ve discussed the story elements of a sales presentation and your slide deck, what else should you bring to the meeting?
Most sales presentations are in-person affairs and include visual elements like a sales deck, handouts or even an in-person demonstration of the physical product. Here are a few things to think about including in your pitch.

13 examples of sales collateral you need to drive revenue
The product.
Nothing sells a product like seeing it in action.
Take Scrub Daddy, a sponge that changes shape depending on the heat of the water. When Aaron Krause, Scrub Daddy’s founder and inventor, presented the product on Shark Tank in 2012 , he demonstrated the sponge cleaning dirty kitchenware and greasy countertops. He also used bowls of water and two 10-pound weights to show the sponge’s amazing morphic abilities.
The tactic paid off: Scrub Daddy partnered with Lori Greiner for $200,000, in return for 20% equity in the business and is now considered one of Shark Tank’s most successful products.
Not all products are easy to demo, so you may have to improvise.
With a physical product, think of the perfect environment for a demo. What would show the product at its best?
With a digital product, make sure you have the technology on hand to show what your product can do (and check beforehand that the tech works). If it’s a mobile app, have your prospects download it. If it’s a platform, consider producing recorded or interactive product demos that can be embedded in your sales presentation.
For items that are too big to be brought in or which are location-specific, you may have to rely on a video as part of the presentation.

7 steps to putting together a brilliant sales demo
Leave behinds.
Depending on the nature of your solution, you may want to have materials you can leave with the prospects in the room.
This can be as simple as contact information or sales literature you pass out at the end of the presentation. It can also be something that’s part of the presentation, like a QR code that allows them to download the demo on their phones. Whatever format you choose, make sure the material is concise and to the point.
Tailoring your sales presentation to speak to your audience
Once you develop a strong sales deck template, it’s tempting to use it over and over with your target audience. Remember, personalization is essential in sales.
During lead generation , prospecting and sales calls, you know that prospects are more interested in buying if your pitches are tailored to them. It’s the same with your sales presentations, especially if you have an unusual prospect.
Let’s say your product is a CRM that’s normally used by sales organizations, but a human resources department is interested in using it to create a recruiting pipeline.
You wouldn’t use a sales deck with sales-related examples to sell it during the presentation.
Instead, you’d research talent acquisition challenges, ask your product department to create a template or a demo aimed at recruiting and build your sales deck accordingly.
Different industries have unique challenges and opportunities. It’s your responsibility to tailor your value proposition and key bullet points accordingly.
“To craft the perfect sales presentation pitch,” advises Danny Hayward, Sales Manager at Unruly , “ensure you take care of these three things:
Ask the right questions beforehand to understand the needs of the client, especially their flaws
Learn your product inside and out
Rehearse, rehearse and rehearse again
Danny Hayward Sales Manager, Unruly
How to nail your sales presentation delivery
Here are a few tried and true sales presentation techniques to make sure you close the deal.
Whether you’re presenting solo or as part of a team, it’s important to plan in advance. Follow these sales presentation tips for preparation.
Practice, practice, practice . You’ll need to get the timing right, especially if your presentation has a lot of moving parts. Go through it to make sure your timing works, so that you can nail the meeting itself.
Make sure everything works . You don’t want to go into a meeting with a faulty PowerPoint presentation or a broken sample – or find out there is no whiteboard when one is integral to your demonstration. Do your best to make sure everything goes to plan.
Decide on everyone’s roles . This one is just for those presenting as a team. Will different sales reps speak through each section? Will one rep talk while the others handle the sales deck and demo? Decide who will do and say what ahead of time.
Know your attendees. Make sure you know who from the prospect company will be in the meeting, their titles and the roles they each play in the buying process. Conducting light social media research can also clue you into attendees’ past experiences or alma maters (information that can fuel pre-presentation small talk and forge closer connections with your audience).
Practice confident body language
Presentations usually happen in person, which is why you need to practice strong body language. You want to look relaxed and confident (even if you’re shaking in your shoes).
Here are some ways you can improve your body language:
Eye contact . Make and maintain eye contact, even in virtual meetings. This shows people you’re interested in them and invested in what they have to say.
Stand up straight . Pull your shoulders back and straighten your spine; fixing your posture is an easy way to convey confidence. You’ll also feel better if you’re not hunched over.
Chin up. It’s hard when you’re in front of people, but don’t look at the floor or your shoes. Face straight ahead and make eye contact (or look at the back wall rather than the floor.)
Have a firm handshake. Some people judge others by their handshakes. Offer a firm handshake to make a good first impression.
Engage your audience
Presentations can span 30 to 60 minutes or more, so you need to be able to hold your prospects’ attention. There are a number of ways to keep everyone interested:
1. Understand your audience’s attention span
The beginning and the end of your presentation are the most memorable, so that’s where you want to use your strongest material.
Rather than leading with your product’s features, use the first few minutes of a presentation to briefly introduce yourself, and share the compelling story we mentioned earlier. If your demo itself is compelling, lead with that.
Then talk about product features and pricing. Your prospects might have already researched it or can look it up afterward, so it’s fine that it’s occupying real estate in the middle of the presentation.
Lastly, finish strong. Return to your story, sharing how your product solved an important problem. Close with confidence, and open the floor for questions.
2. Be funny
Humor can be tricky, so if you’re not comfortable making jokes, don’t force it. If, however, humor is part of your brand voice and you think it will be well-received by your audience, go for it. Humor can be a good way to connect with prospects, make your presentation memorable and relax everyone in the room.
3. Use a little showmanship
The best thing about a sales presentation is that it lets you show off your product. Unlike a pitch, a presentation lets you pull out the stops, make a splash and showcase your solution.
Use this to your advantage and be as memorable as you possibly can.
Sophie Cameron Business Development Representative, CAKE
What to do after the sales presentation to close the deal
The sales cycle isn’t over when the sales presentation ends. Here are some tips on how to wrap up loose ends and close the deal.
Take questions
Encourage questions to show prospects you care about their experience.
Sometimes prospects may want a question answered right in the middle of a presentation. Interactivity is a great sign of engagement. If that happens, stop the presentation and take their questions head-on to show you’re listening and validate their thoughts.
Other times they may sit silently waiting for you to give them all the information they need.
In either case, proactively ask for questions once you’ve ended your presentation. Encourage them to share their concerns. This is a consultative selling approach that works to build a relationship with your prospects.
By the end of your sales pitch, your prospect should be ready to come along with you and start your business relationship.
Outline the next steps of the process. The first could be offering a trial of your product, scheduling a follow-up meeting or sending over a proposal.
Whatever the steps, make sure they’re clearly defined. If you don’t hear from the prospect soon after the proposal, check back in with a follow-up email or call.

How to write a response-worthy follow-up email (with 15 templates)
Great sales presentation examples (and why they worked)
Here are some sales pitch examples you can use to inform your next sales presentation; these examples range from great sales decks to presentations and we’ll explain why they worked so well.
The successful demo
Stephen Conway of vegan chocolate brand Pure Heavenly opened his elevator pitch on the UK’s Dragons’ Den in 2019 by handing out samples of his chocolate. The product, paired with Stephen’s story about wanting to create an allergen-free treat that his young daughters could enjoy, led to three offers.
Why it worked: Conway knew the strength of his product and packaged it in a personal story, betting (correctly) that it would sell itself.
The data-driven presentation
Lunchbox is a restaurant technology company that specializes in online ordering, customer loyalty and guest engagement software. The sales deck the company used to raise its $50 million Series B in 2022 relied on bold visuals and graphs to illustrate its market opportunity, ARR history and competitive differentiators.

Why it worked: The deck tells two stories, one about the company itself and another about the way consumer dining habits have changed in the wake of COVID-19. Lunchbox used data to show how it met the industry’s new pain points for both itself and other companies.

Sales data: How to analyze sales data and a sample Excel spreadsheet
The presenters with overwhelming confidence
When Brian and Michael Speciale went on Shark Tank in 2017 to pitch their product, The Original Comfy, they had very little – no numbers or inventory, just a prototype of a big fleece blanket/hoodie and video of that hoodie being worn everywhere from the couch to the beach. What they did have was a good product and confidence in that product. Their presentation earned them an offer of $50,000 for 30% from Barbara Corcoran.
Why it worked: Corcoran says she bought in because the Speciale brothers had a good idea, the guts to present it and knew they had to strike while the iron was hot. While you probably should be more prepared for your own sales presentation, the Original Comfy story shows just how important confidence is in a sales presentation.
Begin your sales presentation by capturing your audience’s attention and establishing a solid foundation for the rest of your presentation. Here are some steps to consider:
Greet and introduce yourself
Establish rapport
State the purpose and agenda
Address the pain points
Present a compelling hook
Outline the benefits
Establish credibility
Set expectations
Remember to maintain a confident and enthusiastic demeanor throughout your presentation.
The ideal length of a sales presentation can vary depending on factors such as the complexity of the product or service, the audience’s attention span and the context in which the presentation is being delivered. However, keeping a sales presentation concise, focused and within the timeframe is generally recommended.
The conclusion of a sales presentation is a significant opportunity to leave a lasting impression and inspire action from your audience. Here are a few steps you should take to end your presentation effectively.
Include a call to action
Summarize key points
Showcase success stories
Open the floor to questions
Offer additional resources
Here’s an example of how to end your presentation:
“To quickly recap, we’ve covered these key points today: [Summarize the main features and benefits briefly].
“Now, let’s revisit our success stories. Our clients, like [Client A] and [Client B], achieved [mention their specific results]. These successes demonstrate how our product/service can deliver tangible benefits for your business.
“I’d be happy to address any questions or concerns you may have. Please feel free to ask about anything related to our offering, implementation process or pricing.
“Before we finish, I’d like to encourage you to take the next step. Schedule a demo, request a trial or start a conversation with our team. Don’t miss the opportunity to experience the advantages firsthand.
“Lastly, we have additional resources available, such as case studies and whitepapers, to provide you with more insights. Feel free to reach out to our team for any further assistance.
“Thank you all for your time and consideration today.”
Final thoughts
It can be tempting to play it safe with a sales presentation by keeping it to a sales deck and a speech – but a sales presentation should be a show-stopper.
The best sales presentation tells your customer’s story, validates with data, offers a demo and more. It’s a major undertaking that shows the strength of your product. Done well, it keeps your prospects engaged and will make them want to do business with you.
Show customers how your product can push their business forward (or better yet, how your product can make them the superhero) and you’ll have a winning sales presentation that sparks your customer’s interest and drives revenue.

Driving business growth
Full access. No credit card needed.
Recommended

Win-win situations in sales: creating value for both sides
Explore how to achieve a win-win situation and master win-win negotiations to succeed in sales and foster lasting business relationships.
Sales collateral gives customers the right information to make a decision. Build this toolbox of 13 revenue-driving resources to help push deals forward.
A good sales demo does more than just showcase your offering. It can help you win over prospects by connecting your product directly to their needs. In this article, we’ll walk you through the steps to putting together a brilliant sales demo with questions designed to put you in the shoes of your prospects.
35+ Best Sales PowerPoint Templates (Sales PPT Pitches)
Learning to craft successful and better-looking sales presentations is one of the key skills you should master as a marketer or sales rep.
In this digital era, being able to deliver great presentations is not enough. You also need to be able to design attractive and beautiful slides that engage with your audience while adding more context to your speech.
The good news is that you don’t have to be a designer or take courses to design such effective PowerPoint presentations. All you need is the right PowerPoint template.
In this post, we bring you a collection of PowerPoint sales presentation templates to help you find the right designs for your sales plan, proposal, and pitch slide decks. Be sure to save these templates for future events and meetings.
2 Million+ PowerPoint Templates, Themes, Graphics + More
Download thousands of PowerPoint templates, and many other design elements, with a monthly Envato Elements membership. It starts at $16 per month, and gives you unlimited access to a growing library of over 2,000,000 presentation templates, fonts, photos, graphics, and more.

Business PPT Templates
Corporate & pro.

Pitch PowerPoint

Animated PPT Templates
Fully animated.

Maximus Template

Pitch Deck Templates
Startup pitch deck.
Explore PowerPoint Templates
SalesUp – Sales & Marketing PowerPoint Template

SalesUp is a dynamic PowerPoint template designed for effective sales and marketing presentations. With 15 unique slides, a light background, and a widescreen format, this template also includes a handmade infographic feature that can be fully customized for any business. It’s ideal for making your business propositions more impactful.
Sales Growth – Marketing PowerPoint Template

This PowerPoint template is perfect for showcasing your sales and business development journey. It features 15 unique slides, a light background, and captivating handmade infographics, all housed within a widescreen format. The template is fully customizable, allowing a personalized touch to your presentations.
Sales Deck Presentation PowerPoint Template

A versatile PowerPoint template designed to enhance your sales and business presentations. It boasts features like a 16:9 widescreen size, unique slide variations, editable charts and elements, a preset color scheme, and more. This easy-to-use template equips you with infographics for each stage of business development, aiming to boost user satisfaction and improve your brand’s presence.
Modern Sales Strategy PowerPoint Template

This PowerPoint template is a highly customizable slideshow for creating impactful presentations. Featuring a yellow and purple design, the template includes 20 unique slide layouts with easily editable graphics, infographics, and placeholders for pictures. Ideal for a range of business purposes like sales strategies or company profiles.
Dark Sales Strategy PowerPoint Template

A stylish PowerPoint template aimed at enhancing your sales presentations. Featuring a widescreen format, unique slides, editable charts, and elements, it is user-friendly and adaptable to your brand’s needs. From kick-starting a project to improving goal propositions, this template is designed to give your talks an edge.
Sales Plan PowerPoint Template

An expertly crafted PowerPoint template designed to communicate sales strategies and objectives clearly to varied audiences. Its presentation potential spans from showcasing marketing campaigns to 30-60-90 day plans. The template allows for easy customization of features such as pie charts, colors, and text to fit your specific needs.
Sales Growth Strategy PowerPoint Presentation

This is an impressive PowerPoint template that allows you to build sales presentations in minutes. It’s perfect for various needs – be it a sales pitch, an innovative sales strategy display, or regular business meeting. The template includes useful features like fonts, color schemes, and image placeholders.
Sales Growth PowerPoint Template

A carefully crafted PowerPoint template perfect for illustrating sales tactics, performance indicators, and growth plans in a professional and engaging way. Tailored for sales pros, business development teams, and marketing managers, this template, presented in PowerPoint format, offers uncomplicated personalization options.
Business Funnels Infographics PowerPoint Template

This is a unique and professional PowerPoint template to enhance your sales presentations. With 16 characterized slides, it’s easily customizable and comes with drag-and-drop image options, editable charts, and distinctive mockup devices. This template is specially designed to emphasize text readability and usability, ensuring your ideas are well communicated.
Sales Dashboard Infographic PowerPoint Template

This PowerPoint template is perfect for dynamic business and sales presentations and showcasing company profiles. This package features 30 unique, widescreen (16:9) infographic slides, designed for accessibility and ease of use.
Business Sales PowerPoint Presentation Template

Sales presentations don’t always have to be all stats and data, they can be beautiful too. This PowerPoint template allows you to design more effective slideshows with modern layouts with creative animations. There are more than 50 unique slide designs included in this template. You can easily edit and customize them to your preference.
Sales Strategy Powerpoint Template

If you want to make your sales strategy presentations more effective, you should consider creating a slideshow with more visual elements. This PowerPoint template will help you get that job done. It includes 30 unique slides you can use to present your sales plan and strategy in a step-by-step approach.
Sales Pitch PowerPoint Template

A great pitch deck goes a long way to make sure your sales pitch stays on point. It will also help convince your audience of your skills and knowledge on the topic. Be sure to use this PowerPoint template to design such a killer slide deck for your sales pitch presentations. It includes 20 master slide layouts with fully customizable layouts.
Marketing & Sales Strategy PowerPoint Template

There are many different types of charts, graphs, and infographics you need to use in your sales presentations to visualize data and key points. This PowerPoint template includes 30 unique slides you can use to add some of the most popular charts and graphs to your presentations. There are slides for sales cycles, planning, strategy model, B2C and B2B strategy plans, and much more.
B2B Marketing and Sales PowerPoint Template

Whether you’re working on a smart strategy for your B2B marketing approach or creating a master plan to beat your competitors, this B2B marketing PowerPoint template will help you create the best presentation to showcase your plan. It includes a total of 60 slide layouts that can be used to create both marketing and sales presentations.
Sales Meeting – Free PowerPoint Template

This is a free PowerPoint template that comes with a set of slides you can create professional slide decks for sales meetings. It features 30 unique slides with modern designs and fully customizable layouts.
Free Sales Planning Process PowerPoint Template

With this free PowerPoint template, you can create visual presentations for your sales process presentations. There are 35 different slides included in this template that you can edit and customize to change colors, fonts, and images.
Sales – Marketing PowerPoint Presentation

This professional PowerPoint sales presentation template uses a beautiful color scheme to create a consistent look across all its slides. The template lets you choose from 40 different slide designs to create slideshows for all kinds of sales and marketing presentations. The template includes master slides as well.
Sales Funnel PowerPoint Template

Sales funnels are an important part of creating an effective sales strategy. With this PowerPoint template, you can create a presentation to showcase your plan for sales funnels with lots of visual elements. There are 20 unique master slide layouts included in this template that feature important charts, graphs, and infographics for sales funnel presentations.
Sales Proposal PowerPoint Template

With this PowerPoint presentation, you can create professional slideshows for presenting your sales proposals. The template comes with some of the most important slides for sales slide decks, including slides for showcasing your marketing plan and business strategy. Each slide comes in 5 pre-made color schemes as well.
Anasalez – Sales Analysis PowerPoint Presentation

You can make a complete visual analysis of your sales process or plans using this useful PowerPoint template. It comes with more than 50 unique slides that are designed specifically for sales presentations. Each slide is available in both light and dark color themes as well as 10 pre-made color schemes.
Sales and Digital Funnel PowerPoint Templates
This professional PowerPoint template allows you to create more effective slides for showcasing your sales funnels. There are 20 different styles of sales funnel designs included in this template. Each slide can be customized to your preference to change colors, fonts, and images.
Free Creative Sales Strategy Presentation Template

Another free PowerPoint template for creating sales strategy presentations. This template has over 30 unique slides with very creative designs. It features colorful shapes, illustrations, and graphs as well.
Free Sales Process PowerPoint Infographic Slides

Grab this free PowerPoint template to design effective presentations for outlining your sales process. It includes 32 unique slides with many different styles of sales infographic designs.
Dashi – Sales Report PowerPoint Presentation

Dashi is a PowerPoint template made just for professional marketers. You can use it to design visual and beautiful slideshows for presenting your sales dashboards and reports. The template has 10 slides featuring more than 30 character positions, over 2000 vector icons, and 30 business concepts. Each slide is available in light and dark color themes as well as 30 pre-made color schemes.
Sales Pitch Presentation PowerPoint Template

This is a multipurpose PowerPoint template for making all kinds of pitch proposals. Whether it’s a sales pitch, marketing pitch, or even startup pitch decks, this template can handle them all. There are more than 120 unique slides in this template with 6 different color schemes to choose from, making it a total of over 800 slides.
Sales Playbook PowerPoint Template

Creating an attractive slideshow for your sales and marketing campaigns will get much easier when you have this PowerPoint template at your side. It features over 35 unique slide layouts with professional designs. Everything in each slide design, including the colors, fonts, shapes, and images are fully customizable as well.
Sales Process PowerPoint Presentation Template

Use this PowerPoint template to create slides with visual diagrams and graphs for presenting your sales process in a professional way. There are 40 unique slides in this template with useful sales process designs. Each slide is available in 10 different pre-made color schemes, which makes it a total of 400 slides to choose from.
Kanigara – Marketing & Sales PowerPoint Template

Kanigara is another multipurpose PowerPoint template that comes with modern and stylish slides for making all kinds of sales presentations. The template features over 40 slides with beautiful layouts. There are lots of creative graphs, charts, and graphics included in this presentation.
Felicia – Free Sales Presentation PowerPoint Template

This PowerPoint template comes with lots of colorful and creative slide designs for making sales presentations that will surely leave your mark. It includes more than 20 unique slides. And it comes in both PowerPoint and Google Slides versions.
Ardall – Free Sales Presentation Template

Ardall is another free PowerPoint template that’s also available in Google Slides format. This template features a set of modern and professional slides for making sales and marketing presentations. There are 20 slide layouts included in the template.
B2B and B2C Digital Marketing & Sales Presentation

This PowerPoint template works perfectly for creating presentations for both B2B and B2C marketing slideshows. The template includes over 35 unique slides and you can choose from 5 pre-made color schemes as well. The slides are easily customizable to your preference.
Real Estate Marketing & Sales PowerPoint Template

If you’re working on a marketing presentation for a real estate agency, this PowerPoint template will come in handy. It includes 50 unique slides that are designed with property and real estate marketing presentations in mind. They are available in 7 different color schemes.
3D Stairs Diagram for Sales Process Presentation

The stairs diagram is commonly used in marketing and sales presentations to showcase various stats and reports. This PowerPoint template will help you add such diagrams to your presentations with ease. It includes 6 unique slides with 3D-like stair diagram designs.
Ozone – Sales & Marketing Portrait PowerPoint Template

Ozone is a creative PowerPoint template that comes in portrait-style slide designs. There are 50 unique slides included in the template with over 60 master slide layouts to choose from. It features transition animations and infographics as well.
For more great presentation templates, check out our best professional PowerPoint templates collection.
7 Amazing Sales Presentation Examples (And How to Make Them Your Own)

7 Types of Slides to Include In Your Sales Presentation
Inside the mind of your prospect: change is hard, before-after-bridge: the only formula you need to create a persuasive sales presentation, facebook — how smiles and simplicity make you more memorable, contently — how to build a strong bridge, brick by brick, yesware — how to go above and beyond with your benefits, uber — how to cater your content for readers quick to scan, dealtap — how to use leading questions to your advantage, zuora — how to win over your prospects by feeding them dots, linkedin sales navigator — how to create excitement with color, how to make a sales pitch in 4 straightforward steps, 7 embarrassing pitfalls to avoid in your presentation, over to you.
A brilliant sales presentation has a number of things going for it.
Being product-centered isn’t one of them. Or simply focusing on your sales pitch won’t do the trick.
So what can you do to make your offer compelling?
From different types of slides to persuasive techniques and visuals, we’ve got you covered.
Below, we look at data-backed strategies, examples, and easy steps to build your own sales presentations in minutes.
- Title slide: Company name, topic, tagline
- The “Before” picture: No more than three slides with relevant statistics and graphics.
- The “After” picture: How life looks with your product. Use happy faces.
- Company introduction: Who you are and what you do (as it applies to them).
- The “Bridge” slide: Short outcome statements with icons in circles.
- Social proof slides: Customer logos with the mission statement on one slide. Pull quote on another.
- “We’re here for you” slide: Include a call-to-action and contact information.
Many sales presentations fall flat because they ignore this universal psychological bias: People overvalue the benefits of what they have over what they’re missing.
Harvard Business School professor John T. Gourville calls this the “ 9x Effect .” Left unchecked, it can be disastrous for your business.

According to Gourville, “It’s not enough for a new product simply to be better. Unless the gains far outweigh the losses, customers will not adopt it.”
The good news: You can influence how prospects perceive these gains and losses. One of the best ways to prove value is to contrast life before and after your product.
Luckily, there’s a three-step formula for that.
- Before → Here’s your world…
- After → Imagine what it would be like if…
- Bridge → Here’s how to get there.
Start with a vivid description of the pain, present an enviable world where that problem doesn’t exist, then explain how to get there using your tool.
It’s super simple, and it works for cold emails , drip campaigns , and sales discovery decks. Basically anywhere you need to get people excited about what you have to say.
In fact, a lot of companies are already using this formula to great success. The methods used in the sales presentation examples below will help you do the same.
We’re all drawn to happiness. A study at Harvard tells us that emotion is contagious .
You’ll notice that the “Before” (pre-Digital Age) pictures in Facebook’s slides all display neutral faces. But the cover slide that introduces Facebook and the “After” slides have smiling faces on them.
This is important. The placement of those graphics is an intentional persuasion technique.
Studies by psychologists show that we register smiles faster than any other expression. All it takes is 500 milliseconds (1/20th of a second). And when participants in a study were asked to recall expressions, they consistently remembered happy faces over neutral ones.
What to do about it : Add a happy stock photo to your intro and “After” slides, and keep people in “Before” slides to neutral expressions.
Here are some further techniques used during the sales presentation:
Tactic #1: Use Simple Graphics
Use simple graphics to convey meaning without text.
Example: Slide 2 is a picture of a consumer’s hand holding an iPhone — something we can all relate to.
Why It Works: Pictures are more effective than words — it’s called Picture Superiority . In presentations, pictures help you create connections with your audience. Instead of spoon-feeding them everything word for word, you let them interpret. This builds trust.
Tactic #2: Use Icons
Use icons to show statistics you’re comparing instead of listing them out.
Example: Slide 18 uses people icons to emphasize how small 38 out of 100 people is compared to 89 out of 100.
Why It Works: We process visuals 60,000 times faster than text.
Tactic #3: Include Statistics
Include statistics that tie real success to the benefits you mention.
Example: “71% lift driving visits to retailer title pages” (Slide 26).
Why It Works: Precise details prove that you are telling the truth.
Just like how you can’t drive from Marin County to San Francisco without the Golden Gate, you can’t connect a “Before” to an “After” without a bridge.
Add the mission statement of your company — something Contently does from Slide 1 of their deck. Having a logo-filled Customers slide isn’t unusual for sales presentations, but Contently goes one step further by showing you exactly what they do for these companies.

They then drive home the Before-After-Bridge Formula further with case studies:

Before : Customer’s needs when they came on
After: What your company accomplished for them
Bridge : How they got there (specific actions and outcomes)
Here are some other tactics we pulled from the sales presentation:
Tactic #1: Use Graphics/Diagrams
Use graphics, Venn diagrams, and/or equations to drive home your “Before” picture.
Why It Works: According to a Cornell study , graphs and equations have persuasive power. They “signal a scientific basis for claims, which grants them greater credibility.”
Tactic #2: Keep Slides That Have Bullets to a Minimum
Keep slides that have bullets to a minimum. No more than one in every five slides.
Why It Works: According to an experiment by the International Journal of Business Communication , “Subjects exposed to a graphic representation paid significantly more attention to , agreed more with, and better recalled the strategy than did subjects who saw a (textually identical) bulleted list.”
Tactic #3: Use Visual Examples
Follow up your descriptions with visual examples.
Example: After stating “15000+ vetted, ready to work journalists searchable by location, topical experience, and social media influence” on Slide 8, Contently shows what this looks like firsthand on slides 9 and 10.
Why It Works: The same reason why prospects clamor for demos and car buyers ask for test drives. You’re never truly convinced until you see something for yourself.
Which is more effective for you?
This statement — “On average, Yesware customers save ten hours per week” — or this image:

The graphic shows you what that 10 hours looks like for prospects vs. customers. It also calls out a pain that the product removes: data entry.
Visuals are more effective every time. They fuel retention of a presentation from 10% to 65% .
But it’s not as easy as just including a graphic. You need to keep the design clean.

Can you feel it?
Clutter provokes anxiety and stress because it bombards our minds with excessive visual stimuli, causing our senses to work overtime on stimuli that aren’t important.
Here’s a tip from Yesware’s Graphic Designer, Ginelle DeAntonis:
“Customer logos won’t all necessarily have the same dimensions, but keep them the same size visually so that they all have the same importance. You should also disperse colors throughout, so that you don’t for example end up with a bunch of blue logos next to each other. Organize them in a way that’s easy for the eye, because in the end it’s a lot of information at once.”
Here are more tactics to inspire sales presentation ideas:
Tactic #1: Personalize Your Final Slide
Personalize your final slide with your contact information and a headline that drives emotion.
Example: Our Mid-Market Team Lead Kyle includes his phone number and email address with “We’re Here For You”
Why It Works: These small details show your audience that:
- This is about giving them the end picture, not making a sale
- The end of the presentation doesn’t mean the end of the conversation
- Questions are welcomed
Tactic #2: Pair Outcome Statements With Icons in Circles
Example: Slide 4 does this with seven different “After” outcomes.
Why It Works: We already know why pictures work, but circles have power , too. They imply completeness, infiniteness, and harmony.
Tactic #3: Include Specific Success Metrics
Don’t just list who you work with; include specific success metrics that hit home what you’ve done for them.
Example: 35% New Business Growth for Boomtrain; 30% Higher Reply Rates for Dyn.
Why It Works: Social proof drives action. It’s why we wait in lines at restaurants and put ourselves on waitlists for sold-out items.
People can only focus for eight seconds at a time. (Sadly, goldfish have one second on us.)
This means you need to cut to the chase fast.
Uber’s headlines in Slides 2-9 tailor the “After” picture to specific pain points. As a result, there’s no need to explicitly state a “Before.”

Slides 11-13 then continue touching on “Before” problems tangentially with customer quotes:

So instead of self-touting benefits, the brand steps aside to let consumers hear from their peers — something that sways 92% of consumers .
Leading questions may be banned from the courtroom, but they aren’t in the boardroom.
DealTap’s slides ask viewers to choose between two scenarios over and over. Each has an obvious winner:

Ever heard of the Focusing Effect?
It’s part of what makes us tick as humans and what makes this design move effective. We focus on one thing and then ignore the rest. Here, DealTap puts the magnifying glass on paperwork vs. automated transactions.
Easy choice.
Sure, DealTap’s platform might have complexities that rival paperwork, but we don’t think about that. We’re looking at the pile of work one the left and the simpler, single interface on the right.
Here are some other tactics to use in your own sales presentation:
Tactic #1: Tell a Story
Tell a story that flows from one slide to the next.
Example: Here’s the story DealTap tells from slides 4 to 8: “Transactions are complicated” → “Expectations on all sides” → “Too many disconnected tools” → “Slow and error prone process” → “However, there’s an opportunity.
Why It Works: Storytelling in sales with a clear beginning and end (or in this case, a “Before” and “After”) trigger a trust hormone called Oxytocin.
Tactic #2: This vs. That
If it’s hard to separate out one “Before” and “After” vision with your product or service because you offer many dissimilar benefits, consider a “This vs. That” theme for each.
Why It Works: It breaks up your points into simple decisions and sets you up to win emotional reactions from your audience with stock photos.
Remember how satisfying it was to play connect the dots? Forming a bigger picture out of disconnected circles.
That’s what you need to make your audience do.

Zuora tells a story by:
- Laying out the reality (the “Before” part of the Before-After-Bridge formula).
- Asking you a question that you want to answer (the “After”)
- Giving you hints to help you connect the dots
- Showing you the common thread (the “Bridge”)
You can achieve this by founding your sales presentation on your audience’s intuitions. Set them up with the closely-set “dots,” then let them make the connection.
Here are more tactical sales presentation ideas to steal for your own use:
Tactic #1: Use Logos and Testimonials
Use logos and testimonial pull-quotes for your highest-profile customers to strengthen your sales presentation.
Example: Slides 21 to 23 include customer quotes from Schneider Electric, Financial Times, and Box.
Why It Works: It’s called social proof . Prospects value other people’s opinions and trust reputable sources more than you.
Tactic #2: Include White Space
Pad your images with white space.
Example: Slide 17 includes two simple graphics on a white background to drive home an important concept.
Why It Works: White space creates separation, balance, and attracts the audience’s eyes to the main focus: your image.
Tactic #3: Incorporate Hard Data
Incorporate hard data with a memorable background to make your data stand out.
Example: Slide 5 includes statistics with a backdrop that stands out. The number and exciting title (‘A Global Phenomenon’) are the main focuses of the slide.
Why It Works: Vivid backdrops are proven to be memorable and help your audience take away important numbers or data.
Psychology tells us that seeing colors can set our mood .
The color red is proven to increase the pulse and heart rate. Beyond that, it’s associated with being active, aggressive, and outspoken. LinkedIn Sales Navigator uses red on slides to draw attention to main points:

You can use hues in your own slides to guide your audience’s emotions. Green gives peace; grey adds a sense of calm; blue breeds trust. See more here .
Tip: You can grab free photos from Creative Commons and then set them to black & white and add a colored filter on top using a (also free) tool like Canva . Here’s the sizing for your image:

Caveat: Check with your marketing team first to see if you have a specific color palette or brand guidelines to follow.
Here are some other takeaways from LinkedIn’s sales presentation:
Tactic #1: Include a CTA on Final Slide
Include one clear call-to-action on your final slide.
Example: Slide 9 has a “Learn More” CTA button.
Why It Works: According to the Paradox of Choice , the more options you give, the less likely they are to act.
Step One : Ask marketing for your company’s style guide (color, logo, and font style).
Step Two: Answer these questions to outline the “Before → After → Bridge” formula for your sales pitch :
- What are your ICP’s pain points?
- What end picture resonates with them?
- How does your company come into play?
Step Three: Ask account management/marketing which customers you can mention in your slides (plus where to access any case studies for pull quotes).
Step Four: Download photos from Creative Commons . Remember: Graphics > Text. Use Canva to edit on your own — free and fast.

What are the sales presentation strategies that work best for your industry and customers? Tweet us: @Yesware .
Get sales tips and strategies delivered straight to your inbox.
Yesware will help you generate more sales right from your inbox. Try our Outlook add-on or Gmail Chrome extension for free, forever!
Hit your number every month
Works on Outlook or Gmail (+ many more integrations)
Related Articles
![10 Best Persuasive Techniques for Sales and Marketing [2022]](https://www.yesware.com/blog/_next/image/?url=https%3A%2F%2Fwww.yesware.com%2Fwp-content%2Fuploads%2F2021%2F07%2Fyesware-persuasive-techniques.jpg&w=1280&q=75 "sales reporting presentation")
10 Best Persuasive Techniques for Sales and Marketing [2022]

Melissa Williams

SPIN Selling: All-In-One Guide for 2022

High-Ticket Sales: How to Sell High-Ticket Products and Services

Casey O'Connor
Sales, deal management, and communication tips for your inbox
We're on a mission to help you build lasting business relationships.
75 Kneeland Street, Floor 15 Boston, MA 02111
- Design for Business
- Most Recent
- Presentations
- Infographics
- Data Visualizations
- Forms and Surveys
- Video & Animation
- Case Studies
- Digital Marketing
- Design Inspiration
- Visual Thinking
- Product Updates
- Visme Webinars
- Artificial Intelligence
14 Sales Report Templates to Create Daily, Weekly & Monthly Updates

Written by: Olujinmi Oluwatoni
A popular quote by Matt Maher reads, “In order to move forward, you have to look back.” This also applies to sales reports.
Effective sales reports empower you with insights to refine your sales approach and make well-informed decisions. Without it, your company may have a hard time plotting better sales strategies, hitting goals and increasing sales.
So where do you start? Creating your sales report doesn’t have to be a hard nut to crack.
In this article, we'll discuss how to create a professional sales report. We've also handpicked 10 easily customizable sales report templates that will make your reporting a lot easier.
Let's dive in!
Table of Contents
Benefits of a sales report template, main types of sales report template, 10 sales report templates to know, how to create a sales report with visme, sales report faqs.
- Sales report templates are beneficial because they are customizable and adaptive, provide consistency in sales records, enable real-time accessibility and improve clarity and visual impact.
- The main types of sales reports include daily, weekly, monthly and yearly sales reports.
- Follow these steps to create a sales report on Visme: Login to your Visme editor, choose a sales report template, input your sales data, customize your sales report, then publish and share your reports.
- Visme's easy-to-use editor, features and customizable templates to create your professional sales reports. Sign-up for Visme to get started.
The best way for you to begin your sales report is with a professionally designed template. Here are some more benefits of using a sales report template.
Customizable and Adaptive
Sales report templates give you enough control over how your data is presented without the hassle of starting from scratch.
You can easily tailor the template to suit your business needs and adjust the information to portray the most relevant metrics. This flexibility gives room for shifting priorities and emerging trends without the need for extensive design or IT support.
Consistency in Sales Reports
Because sales updates aren't a one-time thing, your report structure and format need to be consistent over time. Using a well-designed sales report template ensures uniformity across documents.
It ensures that the key metrics required are not left out, no matter who is assigned the task. This way, more time can be dedicated to analyzing your sales data rather than figuring out formatting styles. You can take advantage of Visme’s dynamic field feature to easily update fields in multiple documents throughout your sales report.
Real-Time Accessibility
Depending on your team's involvement in sales reporting, various persons may be in charge of tracking and analyzing key data.
A sales report template aids seamless collaboration and gives your team instant access to information. Hence, they can update data in real time regardless of their location. This can help when you or your supervisors require data for quick decision-making.
Clarity and Visual Impact
A bunch of numbers grouped together can mean anything to anyone. But they tell a better story when arranged in tables, charts, or graphs.
Sales report templates help to remove the complexity of sales data. It shows visually appealing figures and elements that can instantly improve communication and understanding.
There is no limit to the data you can record for your sales reports . It can span from daily sales reporting to yearly sales reporting and more.
However, the key metrics captured will vary. Here are the main types of sales reports you may use consistently in your business.
Daily Sales Report
A daily sales report highlights your business’s sales performance for the day. Daily sales report templates capture metrics such as daily revenue, units/items sold per product and expenses or updates done during the day.
Your business may use a daily sales report when:
- There's a need to closely monitor your daily performance and track sales trends, identify fluctuations in demand and evaluate how well you’re meeting their sales targets on a day-to-day basis.
- You need to maintain and oversee optimal inventory levels. You can use these reports to gauge how quickly products are selling and ensure there is enough stock to meet customer demand without overstocking.
- You work in retail or restaurants and your business's revenue is collected at the point of sale .
Daily sales reports provide insights into daily cash flow. This information is essential for managing cash reserves and ensuring operational stability.
A daily sales report is usually one page long, as it doesn't contain much information or require complex data visualization.

Weekly Sales Report
Weekly sales reports assist in operational decisions and facilitate data-driven discussions that help align teams on sales goals and strategies. It helps you answer questions like:
- Which products, regions, or customer segments drive our sales growth?
- What sales activities and channels generate the highest returns?
Weekly sales reports provide insights into individual and team sales performances. It also helps you view metrics such as total weekly revenue, the early impact of promotions or marketing campaigns and weekly trends.

You can compare these trends with previous weeks or analyze the days in the week. Weekly sales reports help you see if people shop better on weekends or what products perform better during rush hours or on different days.
Monthly Sales Report
A monthly sales report provides a snapshot of your business’s sales activities over the past month. It helps you see what trends are emerging over a longer period and the real impact of your marketing or sales efforts.
Monthly reports enable decision-makers to draw meaningful insights that can influence strategy for the next month or quarter. The beauty of monthly sales reports lies in their ability to detect shifts in consumer preferences or demand for particular products or services.

These reports capture key metrics such as monthly client acquisitions, profit/loss statements, total revenue, key performers and more. By utilizing monthly sales report templates, you can streamline your data organization and analysis. These templates incorporate charts, graphs and tables that enhance the visual representation of your data.
Annual Sales Report
The annual sales report is a crucial tool for tracking your business's success over the year. It offers a clear picture of your sales accomplishments, comparing them with the goals you set. From understanding trends to spotting your best-selling products and highlighting areas needing a boost, this report is a goldmine of targeted information.

Use this report at the end of the business year to analyze sales trends, identify efficient operations and highlight areas for improvement. The key metrics in an annual sales report include total revenue, sales growth, sales by product or service, sales relation to targets and more.
Here are ten professionally designed sales templates that can aid in your daily, weekly, monthly, or even yearly sales updates.
Pyramid Chart Template
Imagine effortlessly crafting a chart that expertly showcases your sales distribution across countries or continents. This dynamic pyramid chart template serves as your quick and easy sales distribution report.
With this template, you can spotlight your product’s top sales regions. This can provide an overview of your product’s performance and ignite meaningful discussions and deliberations.
Visme's user-friendly drag-and-drop editor makes it easy to customize, allowing you to tailor the chart to reflect your business needs. With a few clicks, you'll have a chart that doesn't just present data but tells a captivating story in your sales reports.

Sales Daily Report Template
Keep track of your stores' daily operations with this daily sales report template. It captures all important metrics in a simple table format. With this template, all you have to do is input your sales data for the day into the table and modify the date of the report.
Feel free to customize your daily report by adding your logo, icons and unique data widgets.
You can easily collaborate with your team members while preparing your sales report using Visme’s collaboration tool . Simply add them to your document so they can drop their comments and feedback. With that, there’s no back-and-forth of corrections on your reports. Additionally, with Visme’s workflow management features , you can easily assign roles, manage tasks, set and track deadlines, monitor changes and much more.
Watch this video to learn how the collaboration and feedback tool works.
Modern SaaS Quarterly Report Template
Use this SaaS sales report template to uncover your company’s quarterly performance. This template has a modern and professional design with dynamic lines and bright colors that catch your audience’s eye.
You can take advantage of Visme’s icons , shapes and widgets to highlight your key indicators, such as retention rate, churn rate, product performance and more. Don’t forget to communicate your suggestions at the end of your report to aid in better planning for the next quarter.

Additionally, you can check out our comprehensive guide to creating a quarterly sales report . It includes a step-by-step process and free templates that you can use to create your own.
Promotional Sales Report Template
Say you decided to run a sales campaign during a festive season or holiday. This promotional sales report template can clearly display your campaign goals, funnels, results and observations.
This template has a vibrant design with attention-grabbing colors and content blocks. Its table of contents and eye-catching timeline ensure your message resonates with your audience.

Weekly Profit Statement Report Template
Whether you're a tech startup, a small business, or an established corporation, Visme's weekly profit statement report template is your go-to choice for highlighting your company’s weekly financial performance.
This weekly sales report template contains insightful metrics like an increase in weekly profit, the bestselling items of the week, the net profit achieved and more. It also compares these metrics with the previous week for better understanding.
You can easily customize this sleek template with high-resolution stock photos that subtly enhance your sales report. To make your sales report more aesthetically pleasing, use Visme's AI image edit tools . These advanced features allow you to edit, touch up, unblur and upscale images just from text prompts. It makes enhancing your sales report with high-quality images a hassle-free task.
Monthly Sales Report Template
This monthly sales report template is your go-to solution for sharing vital insights and performance metrics with your supervisors or company stakeholders.
Your monthly sales reports contain data from your daily and weekly sales reports and offer a clear analysis. This template measures the total units of products sold in the month, the increase in sales rates and revenue performance per product.

Utilize interactive features like clickable pop-ups to reveal larger data sets or hover effects to reveal information about chats. This will not only give your readers an immersive experience but add more value to your sales reports.
If you're short on time, you can quickly put together professional sales reports using Visme's AI document generator . Generate a first draft from a text prompt, select your design style and the tool will generate text, images, icons and other design elements. You can further customize the template inside Visme to give it the finishing touches.
Corporate Sales Operational Report Presentation Template
Present your company’s sales achievements with this polished corporate sales report presentation. This template begins with a brief executive summary that highlights the key data discussed in the report.
With this sales presentation template, you can showcase your company’s top performers, key achievements and milestones. You can also include your recommendations and a brief recap of your presentation at the end of your presentation to aid discussion.

Sales Progress Report Template
This sales progress report template is ideal for not just tracking your sales data over a long period of time but also highlighting challenges faced that may have hindered growth.
Including this in your sales report will put into perspective the setbacks your team faced during the month or quarter and can spur discussions on solutions or strategies to combat those setbacks.
Nevertheless, this template beautifully highlights the targets that were accomplished and encourages your team to do more.

Yearly Sales Report Template
This bright and fun template captures your business’s sales operations and activities for an entire year and presents them in a streamlined and understandable manner.
This yearly template records metrics such as the best and worst performing products of the year, as well as the product-to-revenue ratio breakdown.
With a rich and user-friendly layout, this yearly sales template incorporates Visme’s data visualization tools with charts, graphs and diagrams, giving you a clear and complete view of your sales data.
Sales Analytics Report Template
When the sales and marketing departments collaborate, you get a sales analytical report that highlights the efforts and results for each team.
This adaptable template is equipped with sections dedicated to product revenue generation, product demand per month, marketing and sales KPIs, sales revenue, forecasts and more.
With these sales analysis templates, you can monitor your sales cycle and track the impact of your sales and marketing tactics.

With little to no design skills, you can create a visually appealing and effective sales report for your business's needs. Here are five steps to create your sales report with Visme.
1. Create an account or log in to your Visme Editor
You can create an account or log in to the Visme editor. You’ll have access to tools, features and a vast library of templates to choose from.
2. Choose a Sales Report Template
Go over the list of sales report templates we have discussed here or browse through Visme’s large library of templates and choose one that fits your sales needs and goals.
You can try your hands on one or two templates before you decide which one to go with. Each template is easily adjustable, so you won't have difficulty working with anyone.
Hear what one of your users has to say about Visme’s templates:
Graphic Designer
3. Input your Sales Data
Once you have chosen your template, simply input your sales data and key metrics into the designated space provided. If you want to input data manually, simply type into the chart data table on the left side of your screen.
You can easily update the table in your template and include more rows, columns, or categories. You can also import your sales data from Google Sheets, Excel, Google Analytics or Survey Monkey to update bar charts or graphs.
Read this resource to learn more about importing your data into your charts or graphs.
Changing the format of your data is also very easy on Visme. You can adjust your vertical bar chart to a pie or line chart and vise-versa, all with a click! And you don’t have to worry about losing your data or its essence.
Furthermore, you can use Visme's AI text generator for any part of the writing process. You can use it to easily create an initial draft, plan structure, check grammar and adjust the content length. Not only does it jumpstart your creative process, but it also ensures your report is polished and error-free.
4. Customize your Sales Report
Once you fact-check your sales data and key metrics in your report, feel free to customize the sales report template to suit your brand voice, tone and look.
You can adjust the template's font size, type and colors. And if you’d prefer easier customization, you can take advantage of Visme’s brand tool kit , which automatically creates branded documents with your brand assets.
Visme’s easy drag-and-drop feature allows you to add text, icons, widgets and more to your design without stress. You can also add your own professional photos or create new ones with Visme's AI image generator . Simply input the right prompts and you’ll have your professional photos in minutes.
5. Publish and Share your Professional Sales Report
After you’re done customizing your sales report to suit your brand, you can easily share and publish your document . You don’t have to worry about converting your sales reports to various formats or losing the quality of your design along the way.
Visme allows you to download your sales report in PDF, PPTX, or LMS format. You can also share your sales report online if you have a virtual team meeting or privately. Take advantage of Visme’s analytics feature to track your document and know who has viewed it.

You can use Visme's AI report writer for a more streamlined and time-saving process. This AI tool helps you create text and layouts for your report and offers various customization options. With this tool, you can effortlessly handle the report's base details while focusing on perfecting the final version.
Q. What Should Be Included in a Weekly Sales Report?
A weekly sales report should include:
- Number of sales made: Refers to the total number of transactions completed during the week.
- Total revenue: This represents the total amount of money earned from all weekly sales.
- Average transaction value: Calculates the average value of each sales transaction made across the week.
- Sales by product or service: Breaks down the week's total sales by each specific product or service.
- New customer acquisitions: Counts the number of new customers who purchased during the week.
- Progress towards weekly sales targets: Measures how closely the team is to meet its designated sales goals for the week.
- Current prospects: Identifies potential sales or deals currently being pursued and could close soon.
- Lost sales: Captures potential sales that did not materialize during the week.
Q. What Is a Sales KPI Report?
A sales KPI report is a document that tracks a sales team's performance against specific goals using key metrics. It helps assess the business's health, spot trends and identify areas for improvement to enhance sales outcomes.
Q. What Should Be Included in a Daily Sales Report?
A daily sales report should include critical sales metrics to evaluate the day's performance. These include:
- Sales revenue: Total money earned from all sales made during the day.
- Units sold: The total number of individual items or services sold during the day.
- Average order value: The average amount of money spent per transaction within the day.
- Sales by product: A breakdown of sales figures per individual product sold during the day.
- Sales by channel: An observation of different sales channels throughout the day to distribute sales.
- Sales by customer: Analyzing sales data based on individual customers allows us to identify who made purchases during the day.
- Sales by time: An hour-by-hour sales overview to identify the busiest times of the day for sales.
Q. What Does a Good Sales Report Look Like?
A good sales report should be concise, visually appealing and easy to understand. It should include key metrics and insights that help the reader make data-driven decisions about sales performance.
Q. What Should a Monthly Sales Report Look Like?
A comprehensive monthly sales report should cover total sales, monthly growth, product performance, customer insights, sales channels and team achievements. Include data visualizations and actionable recommendations to enhance understanding and decision-making.
Create & Share All Your Sales Reports with Visme
Crafting detailed sales reports will help you make informed decisions, identify opportunities for growth and optimize your sales strategies. Whether you are documenting your daily, weekly, or monthly sales activities, Visme's report maker offers a clear and easy way to present your sales performance.
Visme's sharing and collaboration tools allow you to quickly collaborate with all relevant parties in real-time and disseminate your sales reports beyond the constraints of a single meeting.
Beyond sales reports, Visme allows you to create sales collateral , training materials and other sales enablement content to improve sales performance. If you’re ready to take your sales game to the next level, create your Visme account right away!
Put together effective sales reports with Visme

Trusted by leading brands
Recommended content for you:

Create Stunning Content!
Design visual brand experiences for your business whether you are a seasoned designer or a total novice.
About the Author
Olujinmi is a Content writer for Visme who creates human-first SEO content. She loves helping businesses smash their ROI goals with strategic content development and optimization. When she’s not writing, you’ll find her composing songs.

11 Sales Report Templates & Examples: How to Create a Sales Report Fast

As a sales manager, you have a lot of responsibilities on your plate—including the task of creating sales reports that executives can quickly wrap their heads around.
Aside from managing your sales team, providing coaching, and ensuring growth, sales managers and directors are also tasked with collecting the right data and presenting it to leadership.
I know firsthand that this can be a bit overwhelming. The good news is that creating an effective sales report doesn't have to be stressful. With the right tools and a solid sales report template, you can create an actionable sales report in just a few minutes.
Before we discuss strategy, let's quickly define a sales report and determine which data points it should include.
What is a Sales Report?
Sales managers and other stakeholders use this data to understand overall sales activity and sales team performance, spot issues in the sales process, and make more informed business decisions.
The sales report may also map out effective growth strategies, identify the company’s ideal customers , and outline strategies to streamline the sales process .
Sales reports are usually created by team leaders or sales managers , and are formatted to communicate important data to specific teams or leaders effectively.
You can design your sales report as a multi-page document, an Excel document, a graph, or even a graphic presentation .
How to Write a Sales Report in 5 Steps
Anyone can stuff numbers into a report and drone on in a long meeting. The real challenge is creating a sales report that communicates the right data about the sales process and doesn’t put your audience to sleep. That requires a special touch.
Here are five steps to creating a successful sales report that won't bore your audience to tears.
1. Identify the Purpose of Your Sales Report
The purpose of your report is to share sales metrics. But you can’t possibly fit in every bit of sales data. Instead, focus on the data that helps you or the company achieve specific goals.
Ask yourself why you’re putting together a sales report in the first place. Are you measuring the effectiveness of your promotional campaigns? Do you want to identify interesting sales trends for a sales forecast ? Is your sales report designed to motivate your team or make sure they're making enough outbound calls? Or is it a useful snapshot of sales KPIs for your sales operations team to work with?
The purpose of your sales report is to help you gather and analyze the right kind of data. It will also help you determine the scope of your report, like the time to report.
2. Know Your Sales Report's Audience
Once you know exactly why you’re creating a sales report, the next step is defining your audience so your report can focus on the information they care about.
You wouldn't send the same cold email to a CEO and a marketing director, right? You shouldn't send them the same sales report, either.
A marketing head, for example, is likely interested in details like which marketing campaigns led to the most profitable sales. Your sales director is likely interested in whether reps will meet their quotas.
However, the CEO and other decision-makers are more interested in the “big picture,” such as the company's overall growth, than in the specifics of every campaign.
3. Gather Your Sales Data
Now that you've outlined the purpose and audience for your sales report, it’s time to gather sales data, filter the information, and analyze it. This is the fun part! (Or maybe that's just me.)
Make sure your data collection process is goal-oriented and hassle-free. If possible, use tools that integrate with your CRM or other sales software —this will make pulling the data a lot easier.
Start by outlining the metrics you want to include in your report and the overall trends you think matter. A standard sales report includes core KPIs, team performance, number of goods sold, net revenue retention , net sales, profits, and customer acquisition costs .
You might also include sales growth, regional sales, new opportunities, team performance , or other relevant metrics.
You'll need to clean up or filter the data to remove duplicate records and focus on specific areas to improve data accuracy. For example, if you want to share sales metrics for North America, you'd exclude international numbers.
Next, define the period your report will cover. It’s usually a good idea to compare two different periods—current and previous—for example, you might compare metrics month over month or year over year.
4. Create Engaging Visuals to Highlight Important Sales Metrics
Have you ever sat through a meeting where the presenter reads slides full of text? It's boring—and worse, absorbing data that way is harder.
The way you present data is just as important as the data itself. This is where data visualization can help. Instead of expecting managers to go through spreadsheets full of numbers, use graphs and charts to clearly illustrate the impact of important data, contributing significantly to sales performance management .
For example, a line graph can show the revenue increase or decrease over time. A pie chart can illustrate how much each product contributes to total sales. Bar graphs can be used to compare employee performance.
Visualizing data helps make your sales report easy to understand and digest. It can also highlight important trends and challenges in key sales metrics that might impact sales performance in the coming months.
Plus, using visuals helps you put together a great-looking report that keeps your audience from dozing off.
To create data visualizations, such as graphs, charts, and maps, to use in your reports use a data visualization tool like Google Data Studio .
If your reports highlight challenges/places where you're falling short, consider a SWOT analysis to pinpoint the cause.
Psst...curious about the factors influencing total contract value ? Check out our article!
5. Explain What the Sales Numbers Mean
On their own, numbers can be misleading and lead to erroneous judgments.
This is why it is important to always contextualize the data you present instead of just handing over numbers.
What are the Different Sales Report Types?
There are tons of different types of sales reports, and there's no one right document for every organization. Different teams in the same organization may use different sales reports to highlight different data.
Most reports cover a specific time period, such as daily, weekly, monthly, and quarterly sales reports. However, reports may also cover different steps in the sales process.
Here are the most common types of sales reports-and when to use them.
1. Sales Pipeline Report
The sales pipeline report shares the value of your sales pipeline and how the number of deals in each stage of the pipeline. It highlights how many deals could be lost how many will be won, and how this might impact the company’s overall revenue.
Within the pipeline, all of the key stages of the deals are outlined to provide a clear picture of how daily, weekly, and monthly sales cycles are performing.
Pipeline sales report in Close
Use this sales report to : Showcase success or challenges in your sales pipeline.
2. Conversion Rate Report
A conversion rate, or win rate, report shows how effectively your sales team converts new leads into new customers.
This valuable data provides insights into the strength of your overall sales strategy and highlights the performance of sales representatives and sales teams.
Looking into individual salespeople's conversion rates can show you exactly how that person is performing as well as their overall strengths and weaknesses.
If leads are not turning into won deals and new customers, conversion rate reporting on each stage of the sales process will help you identify areas for improvement.
Use this sales report to : Highlight the difference between leads that close and ones that don't or to highlight the difference in performance between sales reps/teams/campaigns.
3. Customer Churn Report
The churn rate shows the overall rate at which a customer will stop doing business with your company or using your product.
The churn report will show you when customers move on, and it can show you why by providing insights into overall trends.
Churn rate matters to sales because a high churn rate could mean you're targeting the wrong prospects.
Use this sales report to: Track the number of customers to churn and traits they share, such as company size, sales rep, lead source, etc.
4. Sales Forecast Report
A sales forecast is a detailed report estimating how much a company, sales team, or salesperson will sell every week, month, quarter, or year.
A sales forecast helps you spot potential problems early on, when it's still possible to avoid or fix them.
In Close, you can easily forecast future sales using the detailed values in the Pipeline View:
Use this sales report to : Predict future sales by rep, team, location, or lead type.
5. Deals Won and Deals Lost
Tracking deals you win and lose helps you see how the business is doing and how specific sales efforts pay off.
This report will also unlock insights into which of your products are more popular than others.
Using the right data, you can spot trends related to top-performing product offerings and maximize those opportunities to win more business.
Won and lost reports will also help sales managers understand how their sales teams and reps perform individually.
Use this sales report to : Track trends in won and lost deals by product type, company details, sales teams, or specific reps.
6. Average Deal Size
The deal size report helps you determine the number of sales needed to achieve a specific revenue target.
For example, If every won deal produces $5,000 of revenue and your sales goal is $50,000, then you know that your team needs to close ten new deals within that time frame.
This can also assist in planning sales capacity and resource allocation .
Use this sales report to : Track the impact of discounts, rep performance, overall business growth, and campaign impact.
7. Sales Calls Report
You can track the effectiveness of your sales reps by measuring the number of sales phone calls they make to their prospects.
Close Call Explorer
This can help you understand if there are any gaps in close rates or any discrepancies between the number of phone calls versus the number of closed deals.
The call reports can also help you isolate specific metrics and segment data about individual prospects being called.
Activity Comparison Report in Close
Use this sales report to : Set benchmarks for new hires, gather data about valuable leads, and optimize your sales process.
CREATE YOUR OWN SALES REPORT IN CLOSE
4 Free Sales Report Templates (Downloadable in Google Sheets & Microsoft Excel Format)
Now that you understand the importance of sales reports let’s look at a few of the most popular templates. These templates can be accessed in Google Drive or Excel and easily copied and pasted to make them your own.
1. Daily Sales Report Templates
This basic daily sales report template for sales executives includes access to an extensive inventory list you can use to monitor the sales of multiple product lines. If you’re just getting started and a basic template is all you need, try this free daily sales report template in Google Sheets format (you can also download a Microsoft Excel version), brought to you by SmartSheet.
2. Weekly Sales Report Template
Use this weekly sales revenue report template to monitor and keep track of sales activity for a given week against a specific sales goal . Brought to you by Microsoft , this free Google Sheets & Microsoft Excel template allows you to track actions of each salesperson's activities in multiple locations and across several product lines.
3. Total Sales Report Template (with Pivot Table)
Do you love pivot tables? You'll like this sales report template. This spreadsheet (and Google Sheets) makes monitoring product sales and customer performance closely over each quarter easy. You can quickly add customer names and sort by product or customer.
You can download the performance report in Google Doc format and make a copy for your own sales reporting purposes.
4. Sales Forecast Tracker
This monthly sales report template comes from our list of the best sales forecasting templates . It’s designed to help small businesses track sales opportunities, who are assigned to each lead, which phase in the sales pipeline, and the probability of closing the deal.
You can then quickly run essential sales forecast estimates to see how many deals will come through at the end of the month.
Using Sales Reports in Close
Creating sales reports can be a PIA, even when you use a template like the ones we listed above. If those templates aren't quite what you're looking for, try Close's sales reports here .
Our reports feature tons of data, including real-time sales activity reports, success rates, and a team leaderboard. Even better, no Excel formulas are needed. 🙌
Quick Tips to Improve Your Sales Reports
Whether you are a small business (using a small business CRM ) or an enterprise organization with massive resources, the steps above will help you assemble a sales activity report that gets the job done.
However, if you want to be better than average, you'll need to go the extra mile. These strategies will help you create a sales report that delivers actionable data quickly. (And it makes you look good to your boss.)
Start with a Sales Report Summary
Most business reports start with an executive summary —there's a reason for that. Decision makers are busy, so delivering the most relevant data as fast as possible is in your best interest.
Provide a brief overview of the report, including key highlights and takeaways. What data do you have to share? What does it mean, and why does it matter?
Use your top-level sales metrics to create a summary that helps grab attention and tells your audience what to expect so they’re better prepared to process that information.
This could include an initial summary of the following:
- Total number of sales
- Total sales volume
- Total deals in the pipeline
- Total revenue
If you spot major opportunities or possible challenges, include those as well.
Cut Out the Fluff in Your Sales Reports
It can be tempting to include too much in your sales report. But more isn't always better. Instead of stuffing every bit of data into every report, think about who will see it and what data matters to them. This might sometimes mean creating multiple sales reports for different departments.
If you're struggling to remove data, consider adding a "Trends to Monitor" section at the end. List metrics and changes you're monitoring and what impact they might have in the long term.
Use a Sales Report Template
If you don’t have time to design and format a sales report from scratch, use one of the templates above. There are two main benefits of using a sales reporting template:
- A good sales report template provides a well-structured skeleton, so you only need to input your data and information.
- This can help you save a lot of time and effort while still ensuring that you end up with a beautiful and organized report.
Automate Your Sales Reporting with a CRM
If your company uses customer relationship management (CRM) software , you can easily use it to generate a customized and detailed sales report.
Traditional tools like Microsoft Excel or Google Sheets are good for storing data and performing complex calculations, but you must set up formulas and format the sheets from scratch. That's time you could be used to following up on leads or, you know, scrolling Reddit.
A CRM , however, makes it easier to generate a report almost immediately because it's already tracking and storing your sales data in real-time. Whether you're a startup using a CRM or a small business owner seeking to improve your bottom-line metrics, having great sales reporting is essential to making data-informed decisions about how to grow your business best.
You can easily view any time frame, set custom date ranges, compare to previous periods, and analyze sales rep performance.
By automating parts of your sales reporting process, you can reduce the time and effort required to assemble a report that engagingly conveys relevant information.
Most CRMs offer several reports you can generate and customize to fit your needs.
Ready to Create Better Sales Reports?
Sales reporting might not be your favorite part of the job, but it is crucial to growing your business and closing more deals.
Sales reports show what strategies are working and what aren't and highlight opportunities for growth. And they help your boss see when you or your team are killing it.
Follow the steps to create a sales report that conveys the right information and has maximum impact.
WATCH THE ON-DEMAND DEMO

More articles from The Close Blog

Discover our latest free sales tools powered by AI
Learn from the sales pros with our free sales guides.
👀 Turn any prompt into captivating visuals in seconds with our AI-powered design generator ✨ Try Piktochart AI!

Monthly Sales Report Presentation
Presentations
You'll be asked to log in or sign up for a free Piktochart account first.
The monthly sales report is very important in any business success.Hence, it's important for a sales report to be presented accurately and clearly.This monthly sales report presentation template from Piktochart is designed to showcase progress and updates in a clear manner.
Available File Type
Customization.
100% customizable
Template Details
Furthermore, you can use charts and graphs to better highlight key statistics and numbers. You can also customize the template by replacing the text, colors, and logo to suit your corporate branding. Once done, you can download the presentation easily in both PPT or PDF. Start creating for free with Piktochart.
More Templates Like This

Explore All Templates
Free Sales Report PowerPoint Templates

Free Dashboard PowerPoint Template
Free Dashboard PowerPoint Template is a versatile and dynamic presentation template specifically designed for professionals seeking to create compelling presentations on Data Analysis and Market Analysis. This sleek and modern template will enable you to present complex data in an easily digestible and visually appealing manner, ensuring that your audience remains engaged and informed. This …
Download 100% free sales report templates for PowerPoint presentations. Our free sales report PPT templates can help you preparing excellent reports to wow your audience.

Free Laptop PowerPoint Template

Free Business Report PowerPoint Template

CRM PowerPoint Template Diagram

Sales Performance PowerPoint Template

Salesman Report PowerPoint Template

Business Reports PowerPoint
We will send you our curated collections to your email weekly. No spam, promise!
- SUGGESTED TOPICS
- The Magazine
- Newsletters
- Managing Yourself
- Managing Teams
- Work-life Balance
- The Big Idea
- Data & Visuals
- Reading Lists
- Case Selections
- HBR Learning
- Topic Feeds
- Account Settings
- Email Preferences
Avoid These 3 Pitfalls When Giving a Sales Presentation
- Terri L. Sjodin

Lessons from a study of almost 5,000 sales professionals.
A study examined the habits of almost 5,000 sales professionals whose livelihoods depend on their ability to build and deliver persuasive presentations. The findings revealed 12 common mistakes that were consistently self-reported among respondents. Here are the top three to avoid when giving a sales presentation: being overly informative vs. persuasive, failing to close, and “winging it.”
When you work in sales, no business skill is more essential than effective communication. This is especially true when it comes to giving presentations, whether you are presenting in person, over the telephone, or via a videoconferencing platform. Getting to the point, connecting with others quickly, and making a strong pitch can be the difference between moving a transaction forward or losing an opportunity.
- TS Terri L. Sjodin is an award-winning speaker who has specialized in helping people build and deliver more polished, persuasive, and effective presentations for over 30 years. She is the principal and founder of Sjodin Communications , a public speaking, sales training, and consulting firm based in Newport Beach, CA. Her latest book, Presentation Read y , (McGraw-Hill, March 2024) expands on this material.
Partner Center
Moscow Method
What do you think of this template.

Product details
At its core, the MoSCoW method is simply a prioritization framework that can be applied to any kind of situation or project, but it works best when a large number of tasks need to be ruthlessly whittled down into a prioritized and achievable to-do list. The core aim of the process is to classify tasks into four buckets; Must, Should, Could and Won’t. As you can probably fathom, Must is the highest priority bucket, and Won’t is the lowest. You can also presumably now see where the funny capitalization in the term ‘MoSCoW’ derives from. One of the primary benefits of a MoSCoW exercise is that it forces hard decisions to be made regarding which direction a digital product project will take. Indeed, the process is usually the first time a client has been asked to really weigh up which functions are absolutely fundamental to the product (Must), which are merely important (Should) and which are just nice-to-haves (Could). This can make the MoSCoW method challenging, but also incredibly rewarding. It’s not uncommon for there to be hundreds of user stories at this stage of a project, as they cover every aspect of what a user or admin will want to do with the digital product. With so many stories to keep track of it helps to group them into sets. For example, you may want to group all the stories surrounding checkout, or onboarding into one group. When we run a MoSCoW process, we use the following definitions. Must – These stories are vital to the function of the digital product. If any of these stories were removed or not completed, the product would not function. Should – These stories make the product better in important ways, but are not vital to the function of the product. We would like to add these stories to the MVP build, but we’ll only start working on them once all the Must stories are complete. Could – These stories would be nice to have, but do not add lots of extra value for users. These stories are often related to styling or ‘finessing’ a product. Won’t – These stories or functions won’t be considered at this stage as they are either out of scope or do not add value.
The first two slides of the template are similar in design and structure. These slides can be used to provide general information to the team about the client’s needs. The slides will be useful for the product owner, development team, and scrum master. The next slide groups user stories into vertical columns. You can also set a progress status for each user story. The last slide gives you the ability to specify the time spent on each user story. After summing up the time for each group, the team can understand how long it will take them to complete each group. All slides in this template are editable based on your needs. The template will be useful to everyone who uses the Agile method in their work.
Related Products

Best Practice

Extreme Programming

Employee of The Month

Team Meeting Agenda

Team Charter Canvas

Project Dashboard

Resource Planning

Pareto Principle

Current State vs Future State

Project Schedule Template
You dont have access, please change your membership plan., great you're all signed up..., verify your account.
PowerSlides.com will email you template files that you've chosen to dowload.
Please make sure you've provided a valid email address! Sometimes, our emails can end up in your Promotions/Spam folder.
Simply, verify your account by clicking on the link in your email.
What can we help you find?
Our Q2 2024 sales and earnings report
July 30, 2024
Share this article
.st0{fill:#00857C;}

Merck’s ( NYSE: MRK ) Q2 2024 results demonstrate strong business momentum and further progress in our diverse pipeline. Our company announced worldwide sales of $16.1 billion, an increase of 7% from Q2 2023.
“Our business is demonstrating strong momentum as we exit the first half of the year,” said Rob Davis, chairman and chief executive officer. “Through excellent scientific, commercial and operational execution, we’re achieving significant milestones for our company and for patients. I am proud of our dedicated teams around the world that are working tirelessly to advance our deep pipeline as we continue delivering innovation that solves unmet medical needs.”
Merck anticipates full-year 2024 worldwide sales to be between $63.4 billion and $64.4 billion.
Find more details on Q2 2024 results below.
Listen to the sales and earnings call
Read the press release
Download infographic
Where We Work: Our global hub in Zurich
Our former CEO Dr. Roy Vagelos honored for role in helping China combat hepatitis B
Explore more in
Forward-looking statement of merck & co., inc., rahway, n.j., usa.
This website of Merck & Co., Inc., Rahway, N.J., USA (the “company”) includes “forward-looking statements” within the meaning of the safe harbor provisions of the U.S. Private Securities Litigation Reform Act of 1995. These statements are based upon the current beliefs and expectations of the company’s management and are subject to significant risks and uncertainties. There can be no guarantees with respect to pipeline candidates that the candidates will receive the necessary regulatory approvals or that they will prove to be commercially successful. If underlying assumptions prove inaccurate or risks or uncertainties materialize, actual results may differ materially from those set forth in the forward-looking statements. Risks and uncertainties include but are not limited to, general industry conditions and competition; general economic factors, including interest rate and currency exchange rate fluctuations; the impact of pharmaceutical industry regulation and health care legislation in the United States and internationally; global trends toward health care cost containment; technological advances, new products and patents attained by competitors; challenges inherent in new product development, including obtaining regulatory approval; the company’s ability to accurately predict future market conditions; manufacturing difficulties or delays; financial instability of international economies and sovereign risk; dependence on the effectiveness of the company’s patents and other protections for innovative products; and the exposure to litigation, including patent litigation, and/or regulatory actions. The company undertakes no obligation to publicly update any forward-looking statement, whether as a result of new information, future events or otherwise. Additional factors that could cause results to differ materially from those described in the forward-looking statements can be found in the company’s Annual Report on Form 10-K for the year ended December 31, 2023 and the company’s other filings with the Securities and Exchange Commission (SEC) available at the SEC’s Internet site (www.sec.gov). No Duty to Update The information contained in this website was current as of the date presented. The company assumes no duty to update the information to reflect subsequent developments. Consequently, the company will not update the information contained in the website and investors should not rely upon the information as current or accurate after the presentation date.
You are leaving Merck.com
Welcome to merck.com.
By continuing, you will be directed to a site intended only for residents of the United States and Canada. We are called MSD everywhere, except in the United States and Canada where we are known as Merck & Co Inc, Rahway, NJ USA.
AI PPT Maker
Powerpoint Templates
Icon Bundle
Kpi Dashboard
Professional
Business Plans
Swot Analysis
Gantt Chart
Business Proposal
Marketing Plan
Project Management
Business Case
Business Model
Cyber Security
Business PPT
Digital Marketing
Digital Transformation
Human Resources
Product Management
Artificial Intelligence
Company Profile
Acknowledgement PPT
PPT Presentation
Reports Brochures
One Page Pitch
Interview PPT
All Categories

Sales reporting powerpoint presentation with slides
Showcasing sales report and impressing the top management of your company at the same time is near to impossible task. But this can be achieved if you use our 67 slides content- ready Sales Reporting PowerPoint Presentation With Slides. This PowerPoint sample show has all the right slides like compassion, financials, segmentation, new market location, timelines, action plan, case study, clients partners, problem challenges, solution to the problem, our product, key product service offerings, our advantages, us vs. the competition, our offerings vs. the competition, pricing package, product testimonials, product traction, project delivery timeline, service level agreement, and many more. This sales reporting PowerPoint sales sample file will assist you reach the target and get potential buyers. Impress your fellow workers and company heads with this professional and visual PPT deck presentation. This sale reports presentation slides also carries slides like agenda, key managers and contact, our mission, our team, about us, company overview, multilevel hierarchy, matrix chart, mind map chart, post in notes etc. Download our Sales Reporting PowerPoint Presentation With Slides today and capture the spectators attention. Presenting trade and target achievement reports is an unending process. However, don’t panic! Winning sales reporting with our pre made PowerPoint show is quick and easy. Within minutes of downloading our PowerPoint slide deck you are ready with your sales reporting PowerPoint presentation. To cast spotlight on each significant subject of a sales report we have included PPT slides like financials, targets with arrow, action plan, the problem challenges, our solutions for the problem and many more. Best part is that this PPT sample works well for business professionals of sales, sales planning, sales strategists and even for marketing executives.

- Add a user to your subscription for free
You must be logged in to download this presentation.
PowerPoint presentation slides
Presenting Sales Reporting PPT with a set of 63 slides to show your mastery of the subject. Use this ready-made PowerPoint presentation to present before your internal teams or the audience. All presentation designs in this deck have been crafted by our team of expert PowerPoint designers using the best of PPT templates, images, data-driven graphs and vector icons. The content has been well-researched by our team of business researchers. The biggest advantage of downloading this deck is that it is fully editable in PowerPoint. You can change the colors, font and text without any hassle to suit your business needs.

People who downloaded this PowerPoint presentation also viewed the following :
- Themes , Communication , Sales , Marketing , Business Slides , Complete Decks , All Decks , Cost Reduction Strategies , Process Management , Financial Services , Financial Analysis
- Reporting ,
- Investment ,
Content of this Powerpoint Presentation
Slide 1 : This slide introduces Sales Reporting. State Your Company Name and get started. Slide 2 : This is an Agenda slide. State your agendas here. Slide 3 : This is Our Mission slide. State company mission here. Slide 4 : This is Our Mission slide. State company mission here. Slide 5 : This is an Our team slide with name, designation and text boxes to state information. Slide 6 : This is an About Us slide. State company/team specifications here. Slide 7 : This is Company Overview slide to state company specifications on world map image. You may change the slide content as per need. Slide 8 : This is Company Overview slide to state company specifications with silhouettes imagery. Slide 9 : This is a Compare Infographic Butterfly Chart slide to show product/entity comparison. Slide 10 : This is a Financial score slide to present financial aspects etc. Slide 11 : This slide shows Target With Arrow image board. Showcase targets, goals etc. here. Slide 12 : This slide shows Segmentation. Showcase target market, segmentation factors etc. here. Slide 13 : This slide showcases New Market Location on a world map image. Slide 14 : This is a Timeline slide to show company growth, evolution, milestones etc. Slide 15 : This is an Action Plan slide with human and target imagery. Slide 16 : This is an Action Plan slide to state the course of planning, action tactics etc. Slide 17 : This is a Case Study slide showing client, the problem, solution and results. Slide 18 : This is a Case Study slide showing client background, the challenges, solution & benefits etc. Slide 19 : This is a Case Study slide showing Our Unique Approach etc. with imagery and text boxes to state information. Slide 20 : This slide presents Clients Partners to be dipslayed. Slide 21 : This is a Business Quotes slide to convey, express or state your beliefs, message etc. Slide 22 : This is the Pitch slide to state What, How and Why of the respective topic. Slide 23 : This is the Pitch slide to state How Do you solve this problem. Slide 24 : This slide showcases The Problem Challenges with icon imagery. Slide 25 : This slide showcases The Problem Challenges faced. State the kind/number of problems, issues etc. here. Slide 26 : This slide showcases Our Solution To The Problem. Present your solutions here. Slide 27 : This slide showcases Our Solution To The Problem with a creative key imagery. Present your solutions here. Slide 28 : This slide presents The Value Proposition displaying- Cost, Risk, Efforts, Promise, Differentiation and Support. Slide 29 : This slide presents The Value Proposition displaying- Product: Company, Product: Ideal Customer, Experience, Benefits, Features. Slide 30 : This slide showcases Our Product. State product specifications etc. here. Slide 31 : This slide showcases Our Product. State product specifications etc. here. Slide 32 : This slide showcases Key Product Service Offerings. State product offerings, specifications etc. here. Slide 33 : This slide also showcases Key Product Service Offerings. State product offerings, specifications etc. here. Slide 34 : This slide showcases Our Advantages with icon imagery. State your plus points, pros or advantages here. Slide 35 : This slide also presents Our Advantages with icon imagery. State your plus points, pros or advantages here. Slide 36 : This is Us vs. the Competiton slide stating comparison in a quadrant form. Slide 37 : This is Our Offerings vs. the Competiton slide stating comparison in tabular form. Slide 38 : This slide showcases Pricing/ Package. You can show the range as Basic, Standard, Premium to Professional. Slide 39 : This is Product Testimonials slide with respective name, designation, images and text boxes. Slide 40 : This is a Product Traction slide. Monitor/Showcase the information and alter as per need. Slide 41 : This is Project Delivery Timeline slide to present important dates, milestones etc. Slide 42 : This slide presents Service Level Agreement which can be altered as per requirement. Slide 43 : This is Post It Notes slide. Post your notes, data, information here. Slide 44 : This is a Newspaper slide to add memorabilia or important pointers. Slide 45 : This slide showcases Business Plan Puzzle Pieces With Different Height with imagery to add information, specifications etc. Slide 46 : This is a Target Board With Arrow And Cycle Of Icons Flat slide. State your targets here. Slide 47 : This is a Circle Process image slide to add information, specifications etc. Slide 48 : This is a Wi-Fi Accessibility And Social Media Apps slide to present information, specifications etc. Slide 49 : This slide shows a Mind map for representing different entities. Slide 50 : This is a Matrix chart slide. Put relevant comparison data here. Slide 51 : This is a Lego Blocks Process slide with text boxes to show information, specifications etc. Slide 52 : This is a Silhouettes slide titled People On Machine Gear Wheel to show information, specifications etc. Slide 53 : This is a Multilevel Hierarchy For Business Organization chart slide. You can provide your chart and edit it accordingly. Slide 54 : This is a Gear With Idea bulb image slide to show information, innovative ideas etc. Slide 55 : This slide shows a Magnifying glass with Arrows slide to show scope, focus or targets. Slide 56 : This is an Our Services Bar chart title heading slide. Edit as per your requirement. Slide 57 : This is an Our Services funnel image slide. Edit as per your requirement. Slide 58 : This is a Locations slide to show global segragation, presence etc. on a world map and text boxes to make it explicit. Slide 59 : This is a Locations slide to show global segregation, presence etc. on a world map and text boxes to make it explicit. Slide 60 : This is a Contact Details slide. Slide 61 : This is Key Managers And Contact as our team slide. Mention name, designation etc. here. Slide 62 : This too is Key Managers And Contact as our team slide. Mention name, designation etc. here. Slide 63 : This is a Thank You slide for acknowledgement with image.
Sales reporting powerpoint presentation with slides with all 63 slides:
Acquire the benefit of flexibility with our Sales Reporting Deck Complete Powerpoint Deck With Slides. Adjust to changing circumstances.

Ratings and Reviews
by Jacob Wilson
May 9, 2021
by Daron Guzman
May 8, 2021

- Integrations
- Learning Center
MoSCoW Prioritization
What is moscow prioritization.
MoSCoW prioritization, also known as the MoSCoW method or MoSCoW analysis, is a popular prioritization technique for managing requirements.
The acronym MoSCoW represents four categories of initiatives: must-have, should-have, could-have, and won’t-have, or will not have right now. Some companies also use the “W” in MoSCoW to mean “wish.”
What is the History of the MoSCoW Method?
Software development expert Dai Clegg created the MoSCoW method while working at Oracle. He designed the framework to help his team prioritize tasks during development work on product releases.
You can find a detailed account of using MoSCoW prioritization in the Dynamic System Development Method (DSDM) handbook . But because MoSCoW can prioritize tasks within any time-boxed project, teams have adapted the method for a broad range of uses.
How Does MoSCoW Prioritization Work?
Before running a MoSCoW analysis, a few things need to happen. First, key stakeholders and the product team need to get aligned on objectives and prioritization factors. Then, all participants must agree on which initiatives to prioritize.
At this point, your team should also discuss how they will settle any disagreements in prioritization. If you can establish how to resolve disputes before they come up, you can help prevent those disagreements from holding up progress.
Finally, you’ll also want to reach a consensus on what percentage of resources you’d like to allocate to each category.
With the groundwork complete, you may begin determining which category is most appropriate for each initiative. But, first, let’s further break down each category in the MoSCoW method.
Start prioritizing your roadmap
Moscow prioritization categories.

1. Must-have initiatives
As the name suggests, this category consists of initiatives that are “musts” for your team. They represent non-negotiable needs for the project, product, or release in question. For example, if you’re releasing a healthcare application, a must-have initiative may be security functionalities that help maintain compliance.
The “must-have” category requires the team to complete a mandatory task. If you’re unsure about whether something belongs in this category, ask yourself the following.

If the product won’t work without an initiative, or the release becomes useless without it, the initiative is most likely a “must-have.”
2. Should-have initiatives
Should-have initiatives are just a step below must-haves. They are essential to the product, project, or release, but they are not vital. If left out, the product or project still functions. However, the initiatives may add significant value.
“Should-have” initiatives are different from “must-have” initiatives in that they can get scheduled for a future release without impacting the current one. For example, performance improvements, minor bug fixes, or new functionality may be “should-have” initiatives. Without them, the product still works.
3. Could-have initiatives
Another way of describing “could-have” initiatives is nice-to-haves. “Could-have” initiatives are not necessary to the core function of the product. However, compared with “should-have” initiatives, they have a much smaller impact on the outcome if left out.
So, initiatives placed in the “could-have” category are often the first to be deprioritized if a project in the “should-have” or “must-have” category ends up larger than expected.
4. Will not have (this time)
One benefit of the MoSCoW method is that it places several initiatives in the “will-not-have” category. The category can manage expectations about what the team will not include in a specific release (or another timeframe you’re prioritizing).
Placing initiatives in the “will-not-have” category is one way to help prevent scope creep . If initiatives are in this category, the team knows they are not a priority for this specific time frame.
Some initiatives in the “will-not-have” group will be prioritized in the future, while others are not likely to happen. Some teams decide to differentiate between those by creating a subcategory within this group.
How Can Development Teams Use MoSCoW?
Although Dai Clegg developed the approach to help prioritize tasks around his team’s limited time, the MoSCoW method also works when a development team faces limitations other than time. For example:
Prioritize based on budgetary constraints.
What if a development team’s limiting factor is not a deadline but a tight budget imposed by the company? Working with the product managers, the team can use MoSCoW first to decide on the initiatives that represent must-haves and the should-haves. Then, using the development department’s budget as the guide, the team can figure out which items they can complete.
Prioritize based on the team’s skillsets.
A cross-functional product team might also find itself constrained by the experience and expertise of its developers. If the product roadmap calls for functionality the team does not have the skills to build, this limiting factor will play into scoring those items in their MoSCoW analysis.
Prioritize based on competing needs at the company.
Cross-functional teams can also find themselves constrained by other company priorities. The team wants to make progress on a new product release, but the executive staff has created tight deadlines for further releases in the same timeframe. In this case, the team can use MoSCoW to determine which aspects of their desired release represent must-haves and temporarily backlog everything else.
What Are the Drawbacks of MoSCoW Prioritization?
Although many product and development teams have prioritized MoSCoW, the approach has potential pitfalls. Here are a few examples.
1. An inconsistent scoring process can lead to tasks placed in the wrong categories.
One common criticism against MoSCoW is that it does not include an objective methodology for ranking initiatives against each other. Your team will need to bring this methodology to your analysis. The MoSCoW approach works only to ensure that your team applies a consistent scoring system for all initiatives.
Pro tip: One proven method is weighted scoring, where your team measures each initiative on your backlog against a standard set of cost and benefit criteria. You can use the weighted scoring approach in ProductPlan’s roadmap app .
2. Not including all relevant stakeholders can lead to items placed in the wrong categories.
To know which of your team’s initiatives represent must-haves for your product and which are merely should-haves, you will need as much context as possible.
For example, you might need someone from your sales team to let you know how important (or unimportant) prospective buyers view a proposed new feature.
One pitfall of the MoSCoW method is that you could make poor decisions about where to slot each initiative unless your team receives input from all relevant stakeholders.
3. Team bias for (or against) initiatives can undermine MoSCoW’s effectiveness.
Because MoSCoW does not include an objective scoring method, your team members can fall victim to their own opinions about certain initiatives.
One risk of using MoSCoW prioritization is that a team can mistakenly think MoSCoW itself represents an objective way of measuring the items on their list. They discuss an initiative, agree that it is a “should have,” and move on to the next.
But your team will also need an objective and consistent framework for ranking all initiatives. That is the only way to minimize your team’s biases in favor of items or against them.
When Do You Use the MoSCoW Method for Prioritization?
MoSCoW prioritization is effective for teams that want to include representatives from the whole organization in their process. You can capture a broader perspective by involving participants from various functional departments.
Another reason you may want to use MoSCoW prioritization is it allows your team to determine how much effort goes into each category. Therefore, you can ensure you’re delivering a good variety of initiatives in each release.
What Are Best Practices for Using MoSCoW Prioritization?
If you’re considering giving MoSCoW prioritization a try, here are a few steps to keep in mind. Incorporating these into your process will help your team gain more value from the MoSCoW method.
1. Choose an objective ranking or scoring system.
Remember, MoSCoW helps your team group items into the appropriate buckets—from must-have items down to your longer-term wish list. But MoSCoW itself doesn’t help you determine which item belongs in which category.
You will need a separate ranking methodology. You can choose from many, such as:
- Weighted scoring
- Value vs. complexity
- Buy-a-feature
- Opportunity scoring
For help finding the best scoring methodology for your team, check out ProductPlan’s article: 7 strategies to choose the best features for your product .
2. Seek input from all key stakeholders.
To make sure you’re placing each initiative into the right bucket—must-have, should-have, could-have, or won’t-have—your team needs context.
At the beginning of your MoSCoW method, your team should consider which stakeholders can provide valuable context and insights. Sales? Customer success? The executive staff? Product managers in another area of your business? Include them in your initiative scoring process if you think they can help you see opportunities or threats your team might miss.
3. Share your MoSCoW process across your organization.
MoSCoW gives your team a tangible way to show your organization prioritizing initiatives for your products or projects.
The method can help you build company-wide consensus for your work, or at least help you show stakeholders why you made the decisions you did.
Communicating your team’s prioritization strategy also helps you set expectations across the business. When they see your methodology for choosing one initiative over another, stakeholders in other departments will understand that your team has thought through and weighed all decisions you’ve made.
If any stakeholders have an issue with one of your decisions, they will understand that they can’t simply complain—they’ll need to present you with evidence to alter your course of action.
Related Terms
2×2 prioritization matrix / Eisenhower matrix / DACI decision-making framework / ICE scoring model / RICE scoring model
Prioritizing your roadmap using our guide
Talk to an expert.
Schedule a few minutes with us to share more about your product roadmapping goals and we'll tailor a demo to show you how easy it is to build strategic roadmaps, align behind customer needs, prioritize, and measure success.
Share on Mastodon
Press Releases
Intel reports second-quarter 2024 financial results; announces $10 billion cost reduction plan to increase efficiency and market competitiveness, related documents.
NEWS SUMMARY
- Second-quarter revenue of $12.8 billion, down 1% year over year (YoY).
- Second-quarter GAAP earnings (loss) per share (EPS) attributable to Intel was $(0.38); non-GAAP EPS attributable to Intel was $0.02.
- Forecasting third-quarter 2024 revenue of $12.5 billion to $13.5 billion; expecting third-quarter GAAP EPS attributable to Intel of $(0.24); non-GAAP EPS attributable to Intel of $(0.03).
- Implementing comprehensive reduction in spending, including a more than 15% headcount reduction, to resize and refocus.
- Suspending dividend starting in the fourth quarter of 2024. The company reiterates its long-term commitment to a competitive dividend as cash flows improve to sustainably higher levels.
- Achieved key milestones on Intel 18A with the 1.0 Process Design Kit (PDK) released and key power-on of first client and server products on Intel 18A, Panther Lake and Clearwater Forest.
SANTA CLARA, Calif.--(BUSINESS WIRE)-- Intel Corporation today reported second-quarter 2024 financial results.
“Our Q2 financial performance was disappointing, even as we hit key product and process technology milestones. Second-half trends are more challenging than we previously expected, and we are leveraging our new operating model to take decisive actions that will improve operating and capital efficiencies while accelerating our IDM 2.0 transformation,” said Pat Gelsinger, Intel CEO. “These actions, combined with the launch of Intel 18A next year to regain process technology leadership, will strengthen our position in the market, improve our profitability and create shareholder value.”
“Second-quarter results were impacted by gross margin headwinds from the accelerated ramp of our AI PC product, higher than typical charges related to non-core businesses and the impact from unused capacity,” said David Zinsner, Intel CFO. “By implementing our spending reductions, we are taking proactive steps to improve our profits and strengthen our balance sheet. We expect these actions to meaningfully improve liquidity and reduce our debt balance while enabling us to make the right investments to drive long-term value for shareholders.”
Cost-Reduction Plan
As Intel nears the completion of rebuilding a sustainable engine of process technology leadership, it announced a series of initiatives to create a sustainable financial engine that accelerates profitable growth, enables further operational efficiency and agility, and creates capacity for ongoing strategic investment in technology and manufacturing leadership. These initiatives follow the establishment of separate financial reporting for Intel Products and Intel Foundry, which provides a "clean sheet" view of the business and has uncovered significant opportunities to drive meaningful operational and cost efficiencies. The actions include structural and operating realignment across the company, headcount reductions, and operating expense and capital expenditure reductions of more than $10 billion in 2025 compared to previous estimates. As a result of these actions, Intel aims to achieve clear line of sight toward a sustainable business model with the ongoing financial resources and liquidity needed to support the company’s long-term strategy.
The plan will enable the next phase of the company’s multiyear transformation strategy, and is focused on four key priorities:
- Reducing Operating Expenses: The company will streamline its operations and meaningfully cut spending and headcount, reducing non-GAAP R&D and marketing, general and administrative (MG&A) to approximately $20 billion in 2024 and approximately $17.5 billion in 2025, with further reductions expected in 2026. Intel expects to reduce headcount by greater than 15% with the majority completed by the end of 2024.
- Reducing Capital Expenditures: With the end of its historic five-nodes-in-four-years journey firmly in sight, Intel is now shifting its focus toward capital efficiency and investment levels aligned to market requirements. This will reduce gross capital expenditures* in 2024 by more than 20% from prior projections, bringing gross capital expenditures in 2024 to between $25 billion and $27 billion. Intel expects net capital spending* in 2024 of between $11 billion and $13 billion. In 2025, the company is targeting gross capital expenditures between $20 billion and $23 billion and net capital spending between $12 billion and $14 billion.
- Reducing Cost of Sales: The company expects to generate $1 billion in savings in non-variable cost of sales in 2025. Product mix will continue to be a headwind next year, contributing to modest YoY improvements to 2025's gross margin.
- Maintaining Core Investments to Execute Strategy: The company continues to advance its long-term innovation and path to leadership across process technology and products, and the increased efficiency from its actions is expected to further support its execution. In addition, Intel continues to sustain investments to build a resilient and sustainable semiconductor supply chain in the United States and around the world.
Intel is taking the added step of suspending the dividend starting in the fourth quarter, recognizing the importance of prioritizing liquidity to support the investments needed to execute its strategy. The company reiterates its long-term commitment to a competitive dividend as cash flows improve to sustainably higher levels.
Q2 2024 Financial Highlights
|
|
|
| ||||||||||
|
|
|
|
|
|
|
| ||||||
| Revenue ($B) | $12.8 | $12.9 | down 1% |
|
|
| ||||||
| Gross Margin | 35.4% | 35.8% | down 0.4 ppt | 38.7% | 39.8% | down 1.1 ppts | ||||||
| R&D and MG&A ($B) | $5.6 | $5.5 | up 2% | $4.9 | $4.7 | up 5% | ||||||
| Operating Margin | (15.3)% | (7.8)% | down 7.5 ppts | 0.2% | 3.5% | down 3.3 ppts | ||||||
| Tax Rate | 17.5% | 280.5% | n/m** | 13.0% | 13.0% | — | ||||||
| Net Income (loss) Attributable to Intel ($B) | $(1.6) | $1.5 | n/m** | $0.1 | $0.5 | down 85% | ||||||
| Earnings (loss) Per Share Attributable to Intel | $(0.38) | $0.35 | n/m** | $0.02 | $0.13 | down 85% | ||||||
In the second quarter, the company generated $2.3 billion in cash from operations and paid dividends of $0.5 billion.
|
| |
|
| |
Business Unit Summary
Intel previously announced the implementation of an internal foundry operating model, which took effect in the first quarter of 2024 and created a foundry relationship between its Intel Products business (collectively CCG, DCAI and NEX) and its Intel Foundry business (including Foundry Technology Development, Foundry Manufacturing and Supply Chain, and Foundry Services (formerly IFS)). The foundry operating model is a key component of the company's strategy and is designed to reshape operational dynamics and drive greater transparency, accountability, and focus on costs and efficiency. The company also previously announced its intent to operate Altera ® as a standalone business beginning in the first quarter of 2024. Altera was previously included in DCAI's segment results. As a result of these changes, the company modified its segment reporting in the first quarter of 2024 to align to this new operating model. All prior-period segment data has been retrospectively adjusted to reflect the way the company internally receives information and manages and monitors its operating segment performance starting in fiscal year 2024. There are no changes to Intel’s consolidated financial statements for any prior periods.
|
|
|
| ||
| Intel Products: |
|
| ||
| Client Computing Group (CCG) | $7.4 billion | up 9% | ||
| Data Center and AI (DCAI) | $3.0 billion | down 3% | ||
| Network and Edge (NEX) | $1.3 billion | down 1% | ||
| Total Intel Products revenue | $11.8 billion | up 4% | ||
| Intel Foundry | $4.3 billion | up 4% | ||
| All other: |
|
| ||
| Altera | $361 million | down 57% | ||
| Mobileye | $440 million | down 3% | ||
| Other | $167 million | up 43% | ||
| Total all other revenue | $968 million | down 32% | ||
| Intersegment eliminations | $(4.3) billion |
| ||
| Total net revenue | $12.8 billion | down 1% |
Intel Products Highlights
- CCG: Intel continues to define and drive the AI PC category, shipping more than 15 million AI PCs since December 2023, far more than all of Intel's competitors combined, and on track to ship more than 40 million AI PCs by year-end. Lunar Lake, the company’s next-generation AI CPU, achieved production release in July 2024, ahead of schedule, with shipments starting in the third quarter. Lunar Lake will power over 80 new Copilot+ PCs across more than 20 OEMs.
- DCAI: More than 130 million Intel ® Xeon ® processors power data centers around the world today, and at Computex Intel introduced its next-generation Intel ® Xeon ® 6 processor with Efficient-cores (E-cores), code-named Sierra Forest, marking the company’s first Intel 3 server product architected for high-density, scale-out workloads. Intel expects Intel ® Xeon ® 6 processors with Performance-cores (P-cores), code-named Granite Rapids, to begin shipping in the third quarter of 2024. The Intel ® Gaudi ® 3 AI accelerator is also on track to launch in the third quarter and is expected to deliver roughly two-times the performance per dollar on both inference and training versus the leading competitor.
- NEX: Intel announced an array of AI-optimized scale-out Ethernet solutions, including the Intel AI network interface card and foundry chiplets that will launch next year. New infrastructure processing unit (IPU) adaptors for the enterprise are now broadly available and supported by Dell Technologies, Red Hat and others. IPUs will play an increasingly important role in Intel’s accelerator portfolio, which the company expects will help drive AI data center growth and profitability in 2025 and beyond. Additionally, Intel and others announced the creation of the Ultra Accelerator Link, a new industry standard dedicated to advancing high-speed, low-latency communication for scale-up AI systems communication in data centers.
Intel Foundry Highlights
- Intel is nearing the completion of its promised five-nodes-in-four-years strategy, with Intel 18A on track to be manufacturing-ready by the end of this year and production wafer start volumes in the first half of 2025. In July 2024, Intel released to foundry customers the 1.0 PDK for Intel 18A. The company’s first two Intel 18A products, Panther Lake for client — the first microprocessor to use RibbonFet, PowerVia and advanced packaging — and Clearwater Forest for servers, are on track to launch in 2025.
- Ansys, Cadence, Siemens, and Synopsys announced the availability of reference flows for Intel’s embedded multi-die interconnect bridge (EMIB) advanced packaging technology, which simplifies the design process and offers design flexibility. The companies also declared readiness for Intel 18A designs.
- During the quarter, Intel named industry veteran Kevin O'Buckley to lead Foundry Services. The company also recently appointed Dr. Naga Chandrasekaran to lead Intel Foundry Manufacturing and Supply Chain. Their leadership will support Intel’s continued development of the first systems foundry for the AI era.
Other Highlights
Intel announced its second Semiconductor Co-Investment Program (SCIP) agreement, the formation of a joint venture with Apollo related to Intel’s Fab 34 in Ireland. SCIP is an element of Intel’s Smart Capital strategy, a funding approach designed to create financial flexibility to accelerate the company’s strategy, including investing in its global manufacturing operations, while maintaining a strong balance sheet.
Q3 2024 Dividend
The company announced that its board of directors has declared a quarterly dividend of $0.125 per share on the company’s common stock, which will be payable Sept. 1, 2024, to shareholders of record as of Aug. 7, 2024.
As noted earlier, Intel is suspending the dividend starting in the fourth quarter.
Business Outlook
Intel's guidance for the third quarter of 2024 includes both GAAP and non-GAAP estimates as follows:
|
|
|
|
|
|
| Revenue |
| $12.5-13.5 billion |
|
|
| Gross Margin |
| 34.5% |
| 38.0% |
| Tax Rate |
| 34% |
| 13% |
| Earnings (Loss) Per Share Attributable to Intel—Diluted |
| $(0.24) |
| $(0.03) |
Reconciliations between GAAP and non-GAAP financial measures are included below. Actual results may differ materially from Intel’s business outlook as a result of, among other things, the factors described under “Forward-Looking Statements” below. The gross margin and EPS outlook are based on the mid-point of the revenue range.
Earnings Webcast
Intel will hold a public webcast at 2 p.m. PDT today to discuss the results for its second quarter of 2024. The live public webcast can be accessed on Intel's Investor Relations website at www.intc.com . The corresponding earnings presentation and webcast replay will also be available on the site.
Forward-Looking Statements
This release contains forward-looking statements that involve a number of risks and uncertainties. Words such as "accelerate", "achieve", "aim", "ambitions", "anticipate", "believe", "committed", "continue", "could", "designed", "estimate", "expect", "forecast", "future", "goals", "grow", "guidance", "intend", "likely", "may", "might", "milestones", "next generation", "objective", "on track", "opportunity", "outlook", "pending", "plan", "position", "possible", "potential", "predict", "progress", "ramp", "roadmap", "seek", "should", "strive", "targets", "to be", "upcoming", "will", "would", and variations of such words and similar expressions are intended to identify such forward-looking statements, which may include statements regarding:
- our business plans and strategy and anticipated benefits therefrom, including with respect to our IDM 2.0 strategy, Smart Capital strategy, partnerships with Apollo and Brookfield, internal foundry model, updated reporting structure, and AI strategy;
- projections of our future financial performance, including future revenue, gross margins, capital expenditures, and cash flows;
- projected costs and yield trends;
- future cash requirements, the availability, uses, sufficiency, and cost of capital resources, and sources of funding, including for future capital and R&D investments and for returns to stockholders, such as stock repurchases and dividends, and credit ratings expectations;
- future products, services, and technologies, and the expected goals, timeline, ramps, progress, availability, production, regulation, and benefits of such products, services, and technologies, including future process nodes and packaging technology, product roadmaps, schedules, future product architectures, expectations regarding process performance, per-watt parity, and metrics, and expectations regarding product and process leadership;
- investment plans and impacts of investment plans, including in the US and abroad;
- internal and external manufacturing plans, including future internal manufacturing volumes, manufacturing expansion plans and the financing therefor, and external foundry usage;
- future production capacity and product supply;
- supply expectations, including regarding constraints, limitations, pricing, and industry shortages;
- plans and goals related to Intel's foundry business, including with respect to anticipated customers, future manufacturing capacity and service, technology, and IP offerings;
- expected timing and impact of acquisitions, divestitures, and other significant transactions, including the sale of our NAND memory business;
- expected completion and impacts of restructuring activities and cost-saving or efficiency initiatives;
- future social and environmental performance goals, measures, strategies, and results;
- our anticipated growth, future market share, and trends in our businesses and operations;
- projected growth and trends in markets relevant to our businesses;
- anticipated trends and impacts related to industry component, substrate, and foundry capacity utilization, shortages, and constraints;
- expectations regarding government incentives;
- future technology trends and developments, such as AI;
- future macro environmental and economic conditions;
- geopolitical tensions and conflicts and their potential impact on our business;
- tax- and accounting-related expectations;
- expectations regarding our relationships with certain sanctioned parties; and
- other characterizations of future events or circumstances.
Such statements involve many risks and uncertainties that could cause our actual results to differ materially from those expressed or implied, including those associated with:
- the high level of competition and rapid technological change in our industry;
- the significant long-term and inherently risky investments we are making in R&D and manufacturing facilities that may not realize a favorable return;
- the complexities and uncertainties in developing and implementing new semiconductor products and manufacturing process technologies;
- our ability to time and scale our capital investments appropriately and successfully secure favorable alternative financing arrangements and government grants;
- implementing new business strategies and investing in new businesses and technologies;
- changes in demand for our products;
- macroeconomic conditions and geopolitical tensions and conflicts, including geopolitical and trade tensions between the US and China, the impacts of Russia's war on Ukraine, tensions and conflict affecting Israel and the Middle East, and rising tensions between mainland China and Taiwan;
- the evolving market for products with AI capabilities;
- our complex global supply chain, including from disruptions, delays, trade tensions and conflicts, or shortages;
- product defects, errata and other product issues, particularly as we develop next-generation products and implement next-generation manufacturing process technologies;
- potential security vulnerabilities in our products;
- increasing and evolving cybersecurity threats and privacy risks;
- IP risks including related litigation and regulatory proceedings;
- the need to attract, retain, and motivate key talent;
- strategic transactions and investments;
- sales-related risks, including customer concentration and the use of distributors and other third parties;
- our significantly reduced return of capital in recent years;
- our debt obligations and our ability to access sources of capital;
- complex and evolving laws and regulations across many jurisdictions;
- fluctuations in currency exchange rates;
- changes in our effective tax rate;
- catastrophic events;
- environmental, health, safety, and product regulations;
- our initiatives and new legal requirements with respect to corporate responsibility matters; and
- other risks and uncertainties described in this release, our 2023 Form 10-K, and our other filings with the SEC.
Given these risks and uncertainties, readers are cautioned not to place undue reliance on such forward-looking statements. Readers are urged to carefully review and consider the various disclosures made in this release and in other documents we file from time to time with the SEC that disclose risks and uncertainties that may affect our business.
Unless specifically indicated otherwise, the forward-looking statements in this release do not reflect the potential impact of any divestitures, mergers, acquisitions, or other business combinations that have not been completed as of the date of this filing. In addition, the forward-looking statements in this release are based on management's expectations as of the date of this release, unless an earlier date is specified, including expectations based on third-party information and projections that management believes to be reputable. We do not undertake, and expressly disclaim any duty, to update such statements, whether as a result of new information, new developments, or otherwise, except to the extent that disclosure may be required by law.
About Intel
Intel (Nasdaq: INTC) is an industry leader, creating world-changing technology that enables global progress and enriches lives. Inspired by Moore’s Law, we continuously work to advance the design and manufacturing of semiconductors to help address our customers’ greatest challenges. By embedding intelligence in the cloud, network, edge and every kind of computing device, we unleash the potential of data to transform business and society for the better. To learn more about Intel’s innovations, go to newsroom.intel.com and intel.com.
© Intel Corporation. Intel, the Intel logo, and other Intel marks are trademarks of Intel Corporation or its subsidiaries. Other names and brands may be claimed as the property of others.
| Intel Corporation | ||||||||
| Consolidated Condensed Statements of Income and Other Information | ||||||||
|
|
|
| ||||||
|
|
|
| ||||||
|
|
|
|
|
| ||||
|
|
|
|
|
|
|
|
|
|
| Cost of sales |
|
| 8,286 |
|
|
| 8,311 |
|
|
|
|
|
|
|
|
|
|
|
| Research and development |
|
| 4,239 |
|
|
| 4,080 |
|
| Marketing, general, and administrative |
|
| 1,329 |
|
|
| 1,374 |
|
| Restructuring and other charges |
|
| 943 |
|
|
| 200 |
|
|
|
|
|
|
|
|
|
|
|
|
|
|
|
|
|
|
|
|
|
| Gains (losses) on equity investments, net |
|
| (120 | ) |
|
| (24 | ) |
| Interest and other, net |
|
| 80 |
|
|
| 224 |
|
|
|
|
|
|
|
|
|
|
|
| Provision for (benefit from) taxes |
|
| (350 | ) |
|
| (2,289 | ) |
|
|
|
|
|
|
|
|
|
|
| Less: Net income (loss) attributable to non-controlling interests |
|
| (44 | ) |
|
| (8 | ) |
|
|
|
|
|
|
|
|
|
|
|
|
|
|
|
|
|
|
|
|
|
|
|
|
|
|
|
|
|
|
|
|
|
|
|
| ||||
| Weighted average shares of common stock outstanding: |
|
|
|
| ||||
|
|
|
|
|
|
|
|
|
|
|
|
|
|
|
|
|
|
|
|
|
|
|
|
|
| ||||
|
|
|
| ||||||
|
|
|
|
|
| ||||
|
|
|
|
|
| ||||
|
|
|
|
|
|
|
|
|
|
| Dilutive effect of employee equity incentive plans |
|
| — |
|
|
| 14 |
|
|
|
|
|
|
|
|
|
|
|
|
|
|
|
| |||
|
|
|
|
| |||
| Employees |
|
|
| |||
| Intel | 116.5 | 116.4 | 118.1 | |||
| Mobileye and other subsidiaries | 5.3 | 5.2 | 4.7 | |||
| NAND | 3.5 | 3.6 | 4.0 | |||
| Total Intel |
|
|
|
| Employees of the NAND memory business, which we divested to SK hynix on completion of the first closing on December 29, 2021 and fully deconsolidated in Q1 2022. Upon completion of the second closing of the divestiture, which remains pending and subject to closing conditions, the NAND employees will be excluded from the total Intel employee number. |
| Intel Corporation | ||||||||
| Consolidated Condensed Balance Sheets | ||||||||
|
|
|
|
|
| ||||
|
|
|
|
|
| ||||
| Current assets: |
|
|
|
| ||||
| Cash and cash equivalents |
| $ | 11,287 |
|
| $ | 7,079 |
|
| Short-term investments |
|
| 17,986 |
|
|
| 17,955 |
|
| Accounts receivable, net |
|
| 3,131 |
|
|
| 3,402 |
|
| Inventories |
|
|
|
| ||||
| Raw materials |
|
| 1,284 |
|
|
| 1,166 |
|
| Work in process |
|
| 6,294 |
|
|
| 6,203 |
|
| Finished goods |
|
| 3,666 |
|
|
| 3,758 |
|
|
|
|
|
|
|
|
|
|
|
| Other current assets |
|
| 7,181 |
|
|
| 3,706 |
|
|
|
|
|
|
|
|
|
|
|
|
|
|
|
|
| ||||
|
|
|
|
|
|
|
|
|
|
|
|
|
|
|
|
|
|
|
|
|
|
|
|
|
|
|
|
|
|
|
|
|
|
|
|
|
|
|
|
|
|
|
|
|
|
|
|
|
|
|
|
|
|
|
|
|
|
|
|
|
|
|
|
|
| ||||
|
|
|
|
|
| ||||
| Current liabilities: |
|
|
|
| ||||
| Short-term debt |
| $ | 4,695 |
|
| $ | 2,288 |
|
| Accounts payable |
|
| 9,618 |
|
|
| 8,578 |
|
| Accrued compensation and benefits |
|
| 2,651 |
|
|
| 3,655 |
|
| Income taxes payable |
|
| 1,856 |
|
|
| 1,107 |
|
| Other accrued liabilities |
|
| 13,207 |
|
|
| 12,425 |
|
|
|
|
|
|
|
|
|
|
|
|
|
|
|
|
| ||||
|
|
|
|
|
|
|
|
|
|
|
|
|
|
|
|
|
|
|
|
| Stockholders’ equity: |
|
|
|
| ||||
| Common stock and capital in excess of par value, 4,276 issued and outstanding (4,228 issued and outstanding as of December 30, 2023) |
|
| 49,763 |
|
|
| 36,649 |
|
| Accumulated other comprehensive income (loss) |
|
| (696 | ) |
|
| (215 | ) |
| Retained earnings |
|
| 66,162 |
|
|
| 69,156 |
|
|
|
|
|
|
|
|
|
|
|
|
|
|
|
|
|
|
|
|
|
|
|
|
|
|
|
|
|
|
|
|
|
|
|
|
|
|
|
|
|
| Intel Corporation | ||||||||
| Consolidated Condensed Statements of Cash Flows | ||||||||
|
|
|
| ||||||
|
|
|
|
|
| ||||
|
|
|
|
|
| ||||
|
|
|
|
|
|
|
|
|
|
| Cash flows provided by (used for) operating activities: |
|
|
|
| ||||
| Net income (loss) |
|
| (2,091 | ) |
|
| (1,295 | ) |
| Adjustments to reconcile net income (loss) to net cash provided by operating activities: |
|
|
|
| ||||
| Depreciation |
|
| 4,403 |
|
|
| 3,733 |
|
| Share-based compensation |
|
| 1,959 |
|
|
| 1,661 |
|
| Restructuring and other charges |
|
| 1,291 |
|
|
| 255 |
|
| Amortization of intangibles |
|
| 717 |
|
|
| 909 |
|
| (Gains) losses on equity investments, net |
|
| (84 | ) |
|
| (146 | ) |
| Changes in assets and liabilities: |
|
|
|
| ||||
| Accounts receivable |
|
| 272 |
|
|
| 1,137 |
|
| Inventories |
|
| (116 | ) |
|
| 1,240 |
|
| Accounts payable |
|
| 184 |
|
|
| (1,102 | ) |
| Accrued compensation and benefits |
|
| (1,309 | ) |
|
| (1,340 | ) |
| Income taxes |
|
| (2,174 | ) |
|
| (2,186 | ) |
| Other assets and liabilities |
|
| (1,983 | ) |
|
| (1,843 | ) |
|
|
|
|
|
|
|
|
|
|
|
|
|
|
|
|
|
|
|
|
| Cash flows provided by (used for) investing activities: |
|
|
|
| ||||
| Additions to property, plant, and equipment |
|
| (11,652 | ) |
|
| (13,301 | ) |
| Proceeds from capital-related government incentives |
|
| 699 |
|
|
| 49 |
|
| Purchases of short-term investments |
|
| (17,634 | ) |
|
| (25,696 | ) |
| Maturities and sales of short-term investments |
|
| 17,214 |
|
|
| 26,957 |
|
| Other investing |
|
| (355 | ) |
|
| 662 |
|
|
|
|
|
|
|
|
|
|
|
| Cash flows provided by (used for) financing activities: |
|
|
|
| ||||
| Issuance of commercial paper, net of issuance costs |
|
| 5,804 |
|
|
| — |
|
| Repayment of commercial paper |
|
| (2,609 | ) |
|
| (3,944 | ) |
| Payments on finance leases |
|
| — |
|
|
| (96 | ) |
| Partner contributions |
|
| 11,861 |
|
|
| 834 |
|
| Proceeds from sales of subsidiary shares |
|
| — |
|
|
| 1,573 |
|
| Issuance of long-term debt, net of issuance costs |
|
| 2,975 |
|
|
| 10,968 |
|
| Repayment of debt |
|
| (2,288 | ) |
|
| — |
|
| Proceeds from sales of common stock through employee equity incentive plans |
|
| 631 |
|
|
| 665 |
|
| Payment of dividends to stockholders |
|
| (1,063 | ) |
|
| (2,036 | ) |
| Other financing |
|
| (444 | ) |
|
| (453 | ) |
|
|
|
|
|
|
|
|
|
|
|
|
|
|
|
|
|
|
|
|
|
|
|
|
|
|
|
|
|
|
| Intel Corporation | ||||||||
| Supplemental Operating Segment Results | ||||||||
|
|
|
| ||||||
|
|
|
|
|
| ||||
|
|
|
|
|
| ||||
|
|
|
|
|
| ||||
|
|
|
|
|
| ||||
| Desktop |
| $ | 2,527 |
|
| $ | 2,370 |
|
| Notebook |
|
| 4,480 |
|
|
| 3,896 |
|
| Other |
|
| 403 |
|
|
| 514 |
|
|
|
|
|
|
|
|
|
|
|
|
|
|
|
|
|
|
|
|
|
|
|
|
|
|
|
|
|
|
|
|
|
|
|
|
|
|
|
|
|
|
|
|
|
|
| ||||
|
|
|
|
|
|
|
|
|
|
|
|
|
|
|
| ||||
| Altera |
|
| 361 |
|
|
| 848 |
|
| Mobileye |
|
| 440 |
|
|
| 454 |
|
| Other |
|
| 167 |
|
|
| 117 |
|
|
|
|
|
|
|
|
|
|
|
|
|
|
|
|
|
|
|
|
|
| Intersegment eliminations |
|
| (4,254 | ) |
|
| (3,941 | ) |
|
|
|
|
|
|
|
|
|
|
|
|
|
|
|
| ||||
|
|
|
|
|
| ||||
|
|
|
|
|
| ||||
|
|
|
|
|
|
|
|
|
|
|
|
|
|
|
|
|
|
|
|
|
|
|
|
|
|
|
|
|
|
|
|
|
|
|
|
|
|
|
|
|
|
|
|
|
| ||||
|
|
|
|
|
|
|
|
|
|
|
|
|
|
|
| ||||
| Altera |
|
| (25 | ) |
|
| 346 |
|
| Mobileye |
|
| 72 |
|
|
| 129 |
|
| Other |
|
| (82 | ) |
|
| (120 | ) |
|
|
|
|
|
|
|
|
|
|
|
|
|
|
|
|
|
|
|
|
| Intersegment eliminations |
|
| (291 | ) |
|
| (413 | ) |
| Corporate unallocated expenses |
|
| (1,720 | ) |
|
| (1,608 | ) |
|
|
|
|
|
|
|
|
|
|
For information about our operating segments, including the nature of segment revenues and expenses, and a reconciliation of our operating segment revenue and operating income (loss) to our consolidated results, refer to our Form 10-K filed on January 26, 2024, Form 8-K furnished on April 2, 2024 and 10-Q filed on August 1, 2024.
Intel Corporation Explanation of Non-GAAP Measures
In addition to disclosing financial results in accordance with US GAAP, this document contains references to the non-GAAP financial measures below. We believe these non-GAAP financial measures provide investors with useful supplemental information about our operating performance, enable comparison of financial trends and results between periods where certain items may vary independent of business performance, and allow for greater transparency with respect to key metrics used by management in operating our business and measuring our performance. Some of these non-GAAP financial measures are used in our performance-based RSUs and our cash bonus plans.
Our non-GAAP financial measures reflect adjustments based on one or more of the following items, as well as the related income tax effects. Income tax effects are calculated using a fixed long-term projected tax rate of 13% across all adjustments. We project this long-term non-GAAP tax rate on at least an annual basis using a five-year non-GAAP financial projection that excludes the income tax effects of each adjustment. The projected non-GAAP tax rate also considers factors such as our tax structure, our tax positions in various jurisdictions, and key legislation in significant jurisdictions where we operate. This long-term non-GAAP tax rate may be subject to change for a variety of reasons, including the rapidly evolving global tax environment, significant changes in our geographic earnings mix, or changes to our strategy or business operations. Management uses this non-GAAP tax rate in managing internal short- and long-term operating plans and in evaluating our performance; we believe this approach facilitates comparison of our operating results and provides useful evaluation of our current operating performance.
Our non-GAAP financial measures should not be considered a substitute for, or superior to, financial measures calculated in accordance with US GAAP, and the financial results calculated in accordance with US GAAP and reconciliations from these results should be carefully evaluated.
|
|
|
|
| Acquisition-related adjustments | Amortization of acquisition-related intangible assets consists of amortization of intangible assets such as developed technology, brands, and customer relationships acquired in connection with business combinations. Charges related to the amortization of these intangibles are recorded within both cost of sales and MG&A in our US GAAP financial statements. Amortization charges are recorded over the estimated useful life of the related acquired intangible asset, and thus are generally recorded over multiple years.
| We exclude amortization charges for our acquisition-related intangible assets for purposes of calculating certain non-GAAP measures because these charges are inconsistent in size and are significantly impacted by the timing and valuation of our acquisitions. These adjustments facilitate a useful evaluation of our current operating performance and comparison to our past operating performance and provide investors with additional means to evaluate cost and expense trends.
|
| Share-based compensation | Share-based compensation consists of charges related to our employee equity incentive plans. | We exclude charges related to share-based compensation for purposes of calculating certain non-GAAP measures because we believe these adjustments provide comparability to peer company results and because these charges are not viewed by management as part of our core operating performance. We believe these adjustments provide investors with a useful view, through the eyes of management, of our core business model, how management currently evaluates core operational performance, and additional means to evaluate expense trends, including in comparison to other peer companies.
|
| Restructuring and other charges | Restructuring charges are costs associated with a restructuring plan and are primarily related to employee severance and benefit arrangements. Other charges include periodic goodwill and asset impairments, and costs associated with restructuring activity. Q2 2024 includes a charge arising out of the R2 litigation. | We exclude restructuring and other charges, including any adjustments to charges recorded in prior periods, for purposes of calculating certain non-GAAP measures because these costs do not reflect our core operating performance. These adjustments facilitate a useful evaluation of our core operating performance and comparisons to past operating results and provide investors with additional means to evaluate expense trends.
|
| (Gains) losses on equity investments, net | (Gains) losses on equity investments, net consists of ongoing mark-to-market adjustments on marketable equity securities, observable price adjustments on non-marketable equity securities, related impairment charges, and the sale of equity investments and other.
| We exclude these non-operating gains and losses for purposes of calculating certain non-GAAP measures because it provides comparability between periods. The exclusion reflects how management evaluates the core operations of the business.
|
| (Gains) losses from divestiture | (Gains) losses are recognized at the close of a divestiture, or over a specified deferral period when deferred consideration is received at the time of closing. Based on our ongoing obligation under the NAND wafer manufacturing and sale agreement entered into in connection with the first closing of the sale of our NAND memory business on December 29, 2021, a portion of the initial closing consideration was deferred and will be recognized between first and second closing.
| We exclude gains or losses resulting from divestitures for purposes of calculating certain non-GAAP measures because they do not reflect our current operating performance. These adjustments facilitate a useful evaluation of our current operating performance and comparisons to past operating results. |
| Adjusted free cash flow | We reference a non-GAAP financial measure of adjusted free cash flow, which is used by management when assessing our sources of liquidity, capital resources, and quality of earnings. Adjusted free cash flow is operating cash flow adjusted for (1) additions to property, plant, and equipment, net of proceeds from capital-related government incentives and partner contributions, and (2) payments on finance leases.
| This non-GAAP financial measure is helpful in understanding our capital requirements and sources of liquidity by providing an additional means to evaluate the cash flow trends of our business. |
| Net capital spending | We reference a non-GAAP financial measure of net capital spending, which is additions to property, plant, and equipment, net of proceeds from capital-related government incentives and partner contributions. | We believe this measure provides investors with useful supplemental information about our capital investment activities and capital offsets, and allows for greater transparency with respect to a key metric used by management in operating our business and measuring our performance.
|
Intel Corporation Supplemental Reconciliations of GAAP Actuals to Non-GAAP Actuals
Set forth below are reconciliations of the non-GAAP financial measure to the most directly comparable US GAAP financial measure. These non-GAAP financial measures should not be considered a substitute for, or superior to, financial measures calculated in accordance with US GAAP, and the reconciliations from US GAAP to Non-GAAP actuals should be carefully evaluated. Please refer to "Explanation of Non-GAAP Measures" in this document for a detailed explanation of the adjustments made to the comparable US GAAP measures, the ways management uses the non-GAAP measures, and the reasons why management believes the non-GAAP measures provide useful information for investors.
|
|
| |||||||
|
|
|
| ||||||
|
|
|
|
|
|
|
| ||
| Acquisition-related adjustments |
| 224 |
|
| 306 |
| ||
| Share-based compensation |
| 195 |
|
| 210 |
| ||
|
|
|
|
|
|
|
| ||
|
|
|
|
|
|
|
| ||
| Acquisition-related adjustments |
| 1.7 | % |
| 2.4 | % | ||
| Share-based compensation |
| 1.5 | % |
| 1.6 | % | ||
|
|
|
|
|
|
|
| ||
|
|
|
|
|
|
|
| ||
| Acquisition-related adjustments |
| (41 | ) |
| (44 | ) | ||
| Share-based compensation |
| (585 | ) |
| (712 | ) | ||
|
|
|
|
|
|
|
| ||
|
|
|
|
|
|
|
| ||
| Acquisition-related adjustments |
| 265 |
|
| 350 |
| ||
| Share-based compensation |
| 780 |
|
| 922 |
| ||
| Restructuring and other charges |
| 943 |
|
| 200 |
| ||
|
|
|
|
|
|
|
| ||
|
|
|
|
|
|
|
| ||
| Acquisition-related adjustments |
| 2.1 | % |
| 2.7 | % | ||
| Share-based compensation |
| 6.1 | % |
| 7.1 | % | ||
| Restructuring and other charges |
| 7.3 | % |
| 1.5 | % | ||
|
|
|
|
|
|
|
| ||
|
|
|
|
|
|
|
| ||
| Income tax effects |
| (4.5 | )% |
| (267.5 | )% | ||
|
|
|
|
|
|
|
| ||
|
|
|
|
|
|
|
| ||
| Acquisition-related adjustments |
| 265 |
|
| 350 |
| ||
| Share-based compensation |
| 780 |
|
| 922 |
| ||
| Restructuring and other charges |
| 943 |
|
| 200 |
| ||
| (Gains) losses on equity investments, net |
| 120 |
|
| 24 |
| ||
| (Gains) losses from divestiture |
| (39 | ) |
| (39 | ) | ||
| Adjustments attributable to non-controlling interest |
| (18 | ) |
| (18 | ) | ||
| Income tax effects |
| (358 | ) |
| (2,373 | ) | ||
|
|
|
|
|
|
|
| ||
|
|
|
| ||||||
|
|
|
|
| |||||
|
|
|
|
|
|
|
| ||
| Acquisition-related adjustments |
| 0.06 |
|
| 0.08 |
| ||
| Share-based compensation |
| 0.18 |
|
| 0.22 |
| ||
| Restructuring and other charges |
| 0.22 |
|
| 0.05 |
| ||
| (Gains) losses on equity investments, net |
| 0.03 |
|
| 0.01 |
| ||
| (Gains) losses from divestiture |
| (0.01 | ) |
| (0.01 | ) | ||
| Adjustments attributable to non-controlling interest |
| — |
|
| — |
| ||
| Income tax effects |
| (0.08 | ) |
| (0.57 | ) | ||
|
|
|
|
|
|
|
| ||
|
|
|
| ||||||
|
|
|
|
|
|
|
| ||
| Net partner contributions and incentives received (cash expended) for property plant and equipment |
| 5,863 |
|
| (5,454 | ) | ||
| Payments on finance leases |
| — |
|
| (81 | ) | ||
|
|
|
|
|
|
|
| ||
|
|
|
|
|
|
|
| ||
|
|
|
|
|
|
|
| ||
Intel Corporation Supplemental Reconciliations of GAAP Outlook to Non-GAAP Outlook
Set forth below are reconciliations of the non-GAAP financial measure to the most directly comparable US GAAP financial measure. These non-GAAP financial measures should not be considered a substitute for, or superior to, financial measures calculated in accordance with US GAAP, and the financial outlook prepared in accordance with US GAAP and the reconciliations from this Business Outlook should be carefully evaluated. Please refer to "Explanation of Non-GAAP Measures" in this document for a detailed explanation of the adjustments made to the comparable US GAAP measures, the ways management uses the non-GAAP measures, and the reasons why management believes the non-GAAP measures provide useful information for investors.
|
|
| |||
|
| Approximately | |||
|
|
|
|
| |
| Acquisition-related adjustments |
| 1.7 | % | |
| Share-based compensation |
| 1.8 | % | |
|
|
|
|
| |
|
|
| |||
|
|
|
|
| |
| Income tax effects |
| (21 | )% | |
|
|
|
|
| |
|
|
| |||
|
|
|
|
| |
| Acquisition-related adjustments |
| 0.06 |
| |
| Share-based compensation |
| 0.23 |
| |
| Restructuring and other charges |
| 0.06 |
| |
| (Gains) losses from divestiture |
| (0.01 | ) | |
| Adjustments attributable to non-controlling interest |
| — |
| |
| Income tax effects |
| (0.13 | ) | |
|
|
|
|
| |
| Non-GAAP gross margin percentage and non-GAAP EPS outlook based on the mid-point of the revenue range. |
Intel Corporation Supplemental Reconciliations of Other GAAP to Non-GAAP Forward-Looking Estimates
Set forth below are reconciliations of the non-GAAP financial measure to the most directly comparable US GAAP financial measure. These non-GAAP financial measures should not be considered a substitute for, or superior to, financial measures calculated in accordance with US GAAP, and the reconciliations should be carefully evaluated. Please refer to "Explanation of Non-GAAP Measures" in this document for a detailed explanation of the adjustments made to the comparable US GAAP measures, the ways management uses the non-GAAP measures, and the reasons why management believes the non-GAAP measures provide useful information for investors.
|
|
|
|
|
|
|
|
| Approximately |
| Approximately |
|
|
|
|
|
|
|
|
|
|
|
|
| Acquisition-related adjustments |
| (0.2) |
| (0.1) |
| Share-based compensation |
| (2.7) |
| (2.5) |
|
|
|
|
|
|
|
|
|
|
|
|
|
|
|
|
|
|
|
|
|
|
|
|
| Proceeds from capital-related government incentives |
| (1.5 - 3.5) |
| (4.0 - 6.0) |
| Partner contributions |
| (12.5) |
| (4.0 - 5.0) |
|
|
|
|
|
|
View source version on businesswire.com: https://www.businesswire.com/news/home/20240801042170/en/
Kylie Altman Investor Relations 1-916-356-0320 [email protected] Penny Bruce Media Relations 1-408-893-0601 [email protected]
Source: Intel Corporation
Released Aug 1, 2024 • 4:01 PM EDT
- Email Alerts
- RSS News Feed
Press Release
P&g announces fourth quarter and fiscal year 2024 results.
Q4 ’24: Net Sales 0%; Organic Sales +2%; Diluted EPS -7%; Core EPS +2%
FY ’24: Net Sales +2%; Organic Sales +4%; Diluted EPS +2%; Core EPS +12%
CINCINNATI--(BUSINESS WIRE)-- The Procter & Gamble Company (NYSE:PG) reported fourth quarter and fiscal year 2024 results.
“Fiscal year 2024 was another year of strong results for P&G,” said Jon Moeller, Chairman of the Board, President and Chief Executive Officer. “The team met or exceeded our going-in plans for organic sales growth, core EPS growth, cash generation and cash returned to shareowners in a challenging economic and geopolitical environment. As we look forward to fiscal 2025, we expect to deliver strong organic sales growth, EPS growth and free cash flow productivity – each in-line with our long-term growth algorithm. We remain committed to our integrated strategy – a focused product portfolio of daily use categories where performance drives brand choice, superiority (of product performance, packaging, brand communication, retail execution and consumer and customer value), productivity, constructive disruption and an agile and accountable organization – all aimed at delivering sustainable, balanced growth and value creation.”
|
| ||||||||
|
|
|
|
|
|
|
|
|
|
| Net Sales | $84.0 | $82.0 | +2% |
| Organic Sales | n/a | n/a | +4% |
| Diluted EPS | $6.02 | $5.90 | +2% |
| Core EPS | $6.59 | $5.90 | +12% |
|
|
|
|
|
|
|
|
|
|
|
| ||||||||
|
|
|
|
|
|
|
|
|
|
| Net Sales | $20.5 | $20.6 | —% |
| Organic Sales | n/a | n/a | +2% |
| Diluted EPS | $1.27 | $1.37 | (7)% |
| Core EPS | $1.40 | $1.37 | +2% |
| * Please refer to Exhibit 1 - Non-GAAP Measures for the definition and reconciliation of these measures to the related GAAP measures. | ||||||||
Fiscal Year 2024 Results
The Company reported fiscal year 2024 net sales of $84.0 billion, an increase of two percent versus the prior year. Organic sales, which excludes the impacts of foreign exchange and acquisitions and divestitures, increased four percent. Higher pricing contributed four points of growth to organic sales. Shipment volumes and mix were unchanged versus the prior year.
Diluted net earnings per share were $6.02, an increase of two percent versus prior year as the increase in net sales was partially offset by a non-cash charge to impair the carrying value of the Gillette trade name intangible asset and higher non-core restructuring charges. Core net earnings per share increased by 12% to $6.59. Currency-neutral core EPS increased 16% versus the prior year EPS.
The Company generated operating cash flow of $19.8 billion and net earnings of $15.0 billion for the fiscal year. Adjusted free cash flow productivity was 105%, which is calculated as operating cash flow less capital spending and certain other items, as a percentage of net earnings excluding the Gillette impairment charge and non-cash charge for accumulated foreign currency translation losses due to the substantial liquidation of operations in certain Enterprise Markets, including Nigeria.
The Company returned over $14 billion of value to shareholders in fiscal 2024 via $9.3 billion in dividend payments and $5 billion of share repurchases. With the dividend increase in April 2024, this marks the 68th consecutive year that P&G has increased its dividend and the 134th consecutive year that P&G has paid a dividend since its incorporation in 1890.
April-June Quarter Results
The Company reported fiscal year 2024 fourth quarter net sales of $20.5 billion, unchanged versus the prior year. A one percent increase in all-in volume and one percent increase due to higher pricing were offset by two percentage points of unfavorable foreign exchange impacts. Organic sales, which excludes the impacts of foreign exchange and acquisitions and divestitures, increased two percent. Excluding the impacts of acquisitions and divestitures, organic volume increased two percent. Mix had a neutral impact on sales growth for the quarter.
Diluted net earnings per share were $1.27, a decrease of seven percent versus the prior year driven primarily by higher restructuring charges related to the substantial liquidation of operations in certain Enterprise Markets, including Nigeria. Core net earnings per share increased two percent to $1.40. Currency-neutral core EPS increased six percent versus the prior year EPS.
Operating cash flow was $5.8 billion and net earnings were $3.1 billion, with adjusted free cash flow productivity of 148%.
April-June Quarter Business Discussion
|
| Volume | Foreign Exchange | Price | Mix | Other | Net Sales | Organic Volume | Organic Sales |
|
| ||||||||
| Beauty | (1)% | (3)% | 3% | —% | —% | (1)% | 1% | 3% |
| Grooming | 2% | (7)% | 5% | —% | —% | —% | 2% | 7% |
| Health Care | 2% | (1)% | 2% | 1% | (1)% | 3% | 1% | 4% |
| Fabric & Home Care | 2% | (1)% | (1)% | 1% | (1)% | —% | 3% | 2% |
| Baby, Feminine & Family Care | (1)% | (2)% | —% | —% | —% | (3)% | (1)% | (1)% |
|
|
|
|
|
|
|
|
|
|
| Net sales percentage changes are approximations based on quantitative formulas that are consistently applied. | ||||||||
| Other includes the sales mix impact from acquisitions and divestitures and rounding impacts necessary to reconcile volume to net sales. | ||||||||
- Beauty segment organic sales increased three percent versus year ago. Skin and Personal Care organic sales were unchanged as growth from increased pricing was offset by lower sales of the super-premium SK-II brand and in Greater China. Hair Care organic sales increased high single digits driven by increased pricing and favorable product mix due to growth of premium products.
- Grooming segment organic sales increased seven percent versus year ago driven by increased pricing primarily in Latin America and volume growth from innovation.
- Health Care segment organic sales increased four percent versus year ago. Oral Care organic sales increased high single digits due to premium product mix and volume growth in North America and Europe. Personal Health Care organic sales were unchanged as growth due to pricing and volume increases were offset by unfavorable mix due to lower incidence of cough and cold.
- Fabric and Home Care segment organic sales increased two percent versus year ago. Fabric Care organic sales were unchanged as volume growth driven by North America and Europe was offset by lower pricing due to increased promotional spending. Home Care organic sales increased high single digits due to volume growth from innovation and favorable product mix.
- Baby, Feminine and Family Care segment organic sales declined one percent versus year ago. Baby Care organic sales decreased mid-single digits due to volume declines from share losses, partially offset by premium product mix. Feminine Care organic sales increased low single digits driven by increased pricing and favorable product mix. Family Care organic sales were unchanged as volume growth was offset by unfavorable product mix.
Diluted net earnings per share were $1.27 for the quarter, a decrease of seven percent versus the prior year driven primarily by higher restructuring charges related to the substantial liquidation of operations in certain Enterprise Markets, including Nigeria. Core net earnings per share increased by two percent to $1.40. Currency-neutral core EPS were up six percent versus the prior year EPS.
Reported gross margin for the quarter increased 120 basis points versus year ago. Core gross margin for the quarter increased 140 basis points versus year ago, 180 basis points on a currency-neutral basis. The increase was driven by 210 basis points of productivity savings, 100 basis points of lower commodity costs and 40 basis points of pricing benefit. These were partially offset by 130 basis points of unfavorable product mix and 40 basis points of product/package reinvestments and other impacts.
Reported selling, general and administrative expense (SG&A) as a percentage of sales increased 260 basis points versus the prior year. Core selling, general and administrative expense (SG&A) as a percentage of sales increased 240 basis points versus year ago and 240 basis points on a currency-neutral basis. The increase was driven by 300 basis points of marketing reinvestments and 30 basis points of wage inflation and overhead investments, partially offset by 40 basis points of productivity savings and 50 basis points of net sales growth leverage and other impacts.
Reported operating margin for the quarter decreased 140 basis points due primarily to higher restructuring charges. Excluding 40 basis points of non-core restructuring charges, core operating margin for the quarter decreased 100 basis points versus the prior year, 60 basis points on a currency-neutral basis. Core operating margin included gross productivity savings of 250 basis points.
Limited Market Portfolio Restructuring
In December 2023, the Company announced a limited market portfolio restructuring of its business operations, primarily in certain Enterprise Markets, including Argentina and Nigeria, to address challenging macroeconomic and fiscal conditions. In connection with this announcement, the Company said that it expects to record incremental restructuring charges of $1.0 to 1.5 billion after tax, including foreign currency translation losses to be recognized upon the substantial liquidation of operations in the affected markets.
As of June 30, 2024, the Company has substantially liquidated its operations in certain Enterprise Markets, including Nigeria, and recorded a non-cash charge of $216 million after tax for accumulated currency translation losses. On July 1, 2024, the Company completed the divestiture of its business in Argentina. The Company expects to record a non-cash charge of approximately $750 million for accumulated currency translation losses in the first quarter of the fiscal year ended June 30, 2025.
Intangible Asset Impairment
In the October-December 2023 quarter of the fiscal year 2024, the Company recorded a $1.3 billion before tax ($1.0 billion after tax) non-cash impairment charge, on intangible assets acquired as part of the Company’s acquisition of The Gillette Company.
The impairment charge arose from a reduction in the estimated fair value of the Gillette indefinite-lived intangible asset due to a higher discount rate, weakening of several currencies relative to the U.S. dollar and the impact of the non-core restructuring program described above. This impairment charge adjusted the carrying value of the Gillette indefinite-lived intangible asset to fair value.
Fiscal Year 2025 Guidance
P&G expects fiscal year 2025 all-in sales growth in the range of two to four percent versus the prior year. Foreign exchange is expected to be a headwind of approximately one percentage point to all-in sales growth. The Company expects organic sales growth in the range of three to five percent.
P&G expects fiscal 2025 diluted net earnings per share growth in the range of 10% to 12% versus fiscal 2024 GAAP EPS of $6.02. P&G expects its fiscal 2025 core net earnings per share growth in the range of five to seven percent versus fiscal 2024 core EPS of $6.59. This outlook equates to a range of $6.91 to $7.05 per share, with a mid-point estimate of $6.98, or an increase of 6%.
The Company said its outlook estimates a net headwind of around $500 million after-tax from unfavorable commodity costs and unfavorable foreign exchange. The net headwind equates to a $0.20 per share for fiscal 2025, or a three percentage drag on core EPS growth.
In addition, the prior fiscal year included benefits from minor brand divestitures and tax impacts that are unlikely to repeat to the same extent in the new fiscal year. Combined, these are an additional $0.10 to $0.12 headwind to core EPS.
The Company is not able to reconcile its forward-looking non-GAAP cash flow and tax rate measures without unreasonable efforts given the unpredictability of the timing and amounts of discrete items, such as acquisitions, divestitures, or impairments, which could significantly impact GAAP results.
P&G said it expects a core effective tax rate to be in the range of 20% to 21% in fiscal 2025.
Capital spending is estimated to be in the range of four to five percent of fiscal 2025 net sales.
P&G said it expects adjusted free cash flow productivity of 90% and expects to pay around $10 billion in dividends and to repurchase $6 to $7 billion of common shares in fiscal 2025.
Forward-Looking Statements
Certain statements in this release, other than purely historical information, including estimates, projections, statements relating to our business plans, objectives and expected operating results, and the assumptions upon which those statements are based, are "forward-looking statements" within the meaning of the Private Securities Litigation Reform Act of 1995, Section 27A of the Securities Act of 1933 and Section 21E of the Securities Exchange Act of 1934. These forward-looking statements generally are identified by the words "believe," "project," "expect," "anticipate," "estimate," "intend," "strategy," "future," "opportunity," "plan," "may," "should," "will," "would," "will be," "will continue," "will likely result" and similar expressions. Forward-looking statements are based on current expectations and assumptions, which are subject to risks and uncertainties that may cause results to differ materially from those expressed or implied in the forward-looking statements. We undertake no obligation to update or revise publicly any forward-looking statements, whether because of new information, future events or otherwise, except to the extent required by law.
Risks and uncertainties to which our forward-looking statements are subject include, without limitation: (1) the ability to successfully manage global financial risks, including foreign currency fluctuations, currency exchange or pricing controls; (2) the ability to successfully manage local, regional or global economic volatility, including reduced market growth rates, and to generate sufficient income and cash flow to allow the Company to effect the expected share repurchases and dividend payments; (3) the ability to successfully manage uncertainties related to changing political and geopolitical conditions and potential implications such as exchange rate fluctuations, market contraction, boycotts, sanctions, or other trade controls; (4) the ability to manage disruptions in credit markets or to our banking partners or changes to our credit rating; (5) the ability to maintain key manufacturing and supply arrangements (including execution of supply chain optimizations and sole supplier and sole manufacturing plant arrangements) and to manage disruption of business due to various factors, including ones outside of our control, such as natural disasters, acts of war or terrorism or disease outbreaks; (6) the ability to successfully manage cost fluctuations and pressures, including prices of commodities and raw materials and costs of labor, transportation, energy, pension and healthcare; (7) the ability to compete with our local and global competitors in new and existing sales channels, including by successfully responding to competitive factors such as prices, promotional incentives and trade terms for products; (8) the ability to manage and maintain key customer relationships; (9) the ability to protect our reputation and brand equity by successfully managing real or perceived issues, including concerns about safety, quality, ingredients, efficacy, packaging content, supply chain practices or similar matters that may arise; (10) the ability to successfully manage the financial, legal, reputational and operational risk associated with third-party relationships, such as our suppliers, contract manufacturers, distributors, contractors and external business partners; (11) the ability to rely on and maintain key company and third-party information and operational technology systems, networks and services and maintain the security and functionality of such systems, networks and services and the data contained therein; (12) the ability to successfully manage the demand, supply and operational challenges, as well as governmental responses or mandates, associated with a disease outbreak, including epidemics, pandemics or similar widespread public health concerns; (13) the ability to stay on the leading edge of innovation, obtain necessary intellectual property protections and successfully respond to changing consumer habits, evolving digital marketing and selling platform requirements and technological advances attained by, and patents granted to, competitors; (14) the ability to successfully manage our ongoing acquisition, divestiture and joint venture activities, in each case to achieve the Company’s overall business strategy and financial objectives, without impacting the delivery of base business objectives; (15) the ability to successfully achieve productivity improvements and cost savings and manage ongoing organizational changes while successfully identifying, developing and retaining key employees, including in key growth markets where the availability of skilled or experienced employees may be limited; (16) the ability to successfully manage current and expanding regulatory and legal requirements and matters (including, without limitation, those laws and regulations involving product liability, product and packaging composition, manufacturing processes, intellectual property, labor and employment, antitrust, privacy, cybersecurity and data protection, artificial intelligence, tax, the environment, due diligence, risk oversight, accounting and financial reporting) and to resolve new and pending matters within current estimates; (17) the ability to manage changes in applicable tax laws and regulations; and (18) the ability to successfully achieve our ambition of reducing our greenhouse gas emissions and delivering progress towards our environmental sustainability priorities.
For additional information concerning factors that could cause actual results and events to differ materially from those projected herein, please refer to our most recent 10-K, 10-Q and 8-K reports.
About Procter & Gamble
P&G serves consumers around the world with one of the strongest portfolios of trusted, quality, leadership brands, including Always®, Ambi Pur®, Ariel®, Bounty®, Charmin®, Crest®, Dawn®, Downy®, Fairy®, Febreze®, Gain®, Gillette®, Head & Shoulders®, Lenor®, Olay®, Oral-B®, Pampers®, Pantene®, SK-II®, Tide®, Vicks®, and Whisper®. The P&G community includes operations in approximately 70 countries worldwide. Please visit https://www.pg.com for the latest news and information about P&G and its brands. For other P&G news, visit us at https://www.pg.com/news .
|
(Amounts in Millions Except Per Share Amounts)
| |||||||||||||||||||||
|
|
|
|
| ||||||||||||||||||
|
|
|
|
|
|
|
|
|
|
|
|
| ||||||||||
|
| $ | 20,532 |
|
| $ | 20,553 |
|
| — | % |
| $ | 84,039 |
|
| $ | 82,006 |
|
| 2 | % |
| Cost of products sold |
| 10,348 |
|
|
| 10,613 |
|
| (2 | )% |
|
| 40,848 |
|
|
| 42,760 |
|
| (4 | )% |
|
|
| 10,183 |
|
|
| 9,940 |
|
| 2 | % |
|
| 43,191 |
|
|
| 39,246 |
|
| 10 | % |
| Selling, general and administrative expense |
| 6,299 |
|
|
| 5,778 |
|
| 9 | % |
|
| 23,305 |
|
|
| 21,112 |
|
| 10 | % |
| Indefinite-lived intangible asset impairment charge |
| — |
|
|
| — |
|
|
|
|
| 1,341 |
|
|
| — |
|
|
| ||
|
|
| 3,884 |
|
|
| 4,162 |
|
| (7 | )% |
|
| 18,545 |
|
|
| 18,134 |
|
| 2 | % |
| Interest expense |
| (220 | ) |
|
| (240 | ) |
| (8 | )% |
|
| (925 | ) |
|
| (756 | ) |
| 22 | % |
| Interest income |
| 107 |
|
|
| 116 |
|
| (8 | )% |
|
| 473 |
|
|
| 307 |
|
| 54 | % |
| Other non-operating income, net |
| 98 |
|
|
| 195 |
|
| (50 | )% |
|
| 668 |
|
|
| 668 |
|
| — | % |
|
|
| 3,870 |
|
|
| 4,233 |
|
| (9 | )% |
|
| 18,761 |
|
|
| 18,353 |
|
| 2 | % |
| Income taxes |
| 726 |
|
|
| 841 |
|
| (14 | )% |
|
| 3,787 |
|
|
| 3,615 |
|
| 5 | % |
|
|
| 3,144 |
|
|
| 3,392 |
|
| (7 | )% |
|
| 14,974 |
|
|
| 14,738 |
|
| 2 | % |
| Less: Net earnings/(loss) attributable to non controlling interests |
| 7 |
|
|
| 8 |
|
| (13 | )% |
|
| 95 |
|
|
| 85 |
|
| 12 | % |
|
| $ | 3,137 |
|
| $ | 3,384 |
|
| (7 | )% |
| $ | 14,879 |
|
| $ | 14,653 |
|
| 2 | % |
|
|
|
|
|
|
|
|
|
|
|
|
| ||||||||||
|
|
| 18.8 | % |
|
| 19.9 | % |
|
|
|
| 20.2 | % |
|
| 19.7 | % |
|
| ||
|
|
|
|
|
|
|
|
|
|
|
|
| ||||||||||
|
|
|
|
|
|
|
|
|
|
|
|
| ||||||||||
| Basic | $ | 1.30 |
|
| $ | 1.40 |
|
| (7 | )% |
| $ | 6.18 |
|
| $ | 6.07 |
|
| 2 | % |
| Diluted | $ | 1.27 |
|
| $ | 1.37 |
|
| (7 | )% |
| $ | 6.02 |
|
| $ | 5.90 |
|
| 2 | % |
|
|
|
|
|
|
|
|
|
|
|
|
| ||||||||||
|
| $ | 1.0065 |
|
| $ | 0.9407 |
|
| 7 | % |
| $ | 3.8286 |
|
| $ | 3.6806 |
|
| 4 | % |
| Diluted Weighted Average Common Shares Outstanding |
| 2,472.2 |
|
|
| 2,477.5 |
|
|
|
|
| 2,471.9 |
|
|
| 2,483.9 |
|
|
| ||
|
|
|
|
|
|
|
|
|
|
|
|
| ||||||||||
|
|
|
|
|
|
|
|
|
|
|
|
| ||||||||||
| Gross margin |
| 49.6 | % |
|
| 48.4 | % |
| 120 |
|
|
| 51.4 | % |
|
| 47.9 | % |
| 350 |
|
| Selling, general and administrative expense |
| 30.7 | % |
|
| 28.1 | % |
| 260 |
|
|
| 27.7 | % |
|
| 25.7 | % |
| 200 |
|
| Operating margin |
| 18.9 | % |
|
| 20.3 | % |
| (140 | ) |
|
| 22.1 | % |
|
| 22.1 | % |
| — |
|
| Earnings before income taxes |
| 18.8 | % |
|
| 20.6 | % |
| (180 | ) |
|
| 22.3 | % |
|
| 22.4 | % |
| (10 | ) |
| Net earnings |
| 15.3 | % |
|
| 16.5 | % |
| (120 | ) |
|
| 17.8 | % |
|
| 18.0 | % |
| (20 | ) |
| Net earnings attributable to Procter & Gamble |
| 15.3 | % |
|
| 16.5 | % |
| (120 | ) |
|
| 17.7 | % |
|
| 17.9 | % |
| (20 | ) |
|
|
| Basic net earnings per common share and Diluted net earnings per common share are calculated on Net earnings attributable to Procter & Gamble. |
| Amounts in millions of dollars except per share amounts or as otherwise specified. Certain columns and rows may not add due to rounding. | ||
|
(Amounts in Millions Except Per Share Amounts)
| ||||||
|
|
| |||||
|
|
|
|
|
|
|
|
| Beauty | $3,724 | (1)% | $690 | (17)% | $536 | (17)% |
| Grooming | 1,657 | —% | 395 | (7)% | 311 | (10)% |
| Health Care | 2,674 | 3% | 433 | 7% | 325 | 9% |
| Fabric & Home Care | 7,265 | —% | 1,598 | (5)% | 1,240 | (5)% |
| Baby, Feminine & Family Care | 5,009 | (3)% | 1,109 | (11)% | 847 | (12)% |
| Corporate | 202 | N/A | (355) | N/A | (116) | N/A |
|
|
|
|
|
|
|
|
|
|
| ||||||
|
|
| ||||||
|
|
|
|
|
|
|
|
|
| Beauty | (1)% | 1% | (3)% | 3% | —% | —% | (1)% |
| Grooming | 2% | 2% | (7)% | 5% | —% | —% | —% |
| Health Care | 2% | 1% | (1)% | 2% | 1% | (1)% | 3% |
| Fabric & Home Care | 2% | 3% | (1)% | (1)% | 1% | (1)% | —% |
| Baby, Feminine & Family Care | (1)% | (1)% | (2)% | —% | —% | —% | (3)% |
|
|
|
|
|
|
|
|
|
|
|
| |||||
|
|
|
|
|
|
|
|
| Beauty | $15,220 | 1% | $3,805 | (5)% | $2,963 | (7)% |
| Grooming | 6,654 | 4% | 1,845 | 2% | 1,477 | 1% |
| Health Care | 11,793 | 5% | 2,941 | 7% | 2,258 | 6% |
| Fabric & Home Care | 29,495 | 4% | 7,339 | 16% | 5,687 | 18% |
| Baby, Feminine & Family Care | 20,277 | —% | 5,253 | 14% | 4,020 | 13% |
| Corporate | 601 | N/A | (2,422) | N/A | (1,430) | N/A |
|
|
|
|
|
|
|
|
|
|
| ||||||
|
|
| ||||||
|
|
|
|
|
|
|
|
|
| Beauty | —% | —% | (2)% | 4% | (1)% | —% | 1% |
| Grooming | 1% | 1% | (5)% | 8% | —% | —% | 4% |
| Health Care | (1)% | (1)% | —% | 4% | 2% | —% | 5% |
| Fabric & Home Care | 1% | 1% | (1)% | 3% | 1% | —% | 4% |
| Baby, Feminine & Family Care | (2)% | (2)% | (2)% | 3% | 1% | —% | —% |
|
|
|
|
|
|
|
|
|
|
| Net sales percentage changes are approximations based on quantitative formulas that are consistently applied. | |
|
| Other includes the sales mix impact from acquisitions and divestitures and rounding impacts necessary to reconcile volume to net sales. | |
| Amounts in millions of dollars except per share amounts or as otherwise specified. Certain columns and rows may not add due to rounding. | ||
|
(Amounts in Millions Except Per Share Amounts)
| |||||||
|
|
| ||||||
|
|
|
|
| ||||
|
| $ | 8,246 |
|
| $ | 7,214 |
|
|
|
|
|
| ||||
| Net earnings |
| 14,974 |
|
|
| 14,738 |
|
| Depreciation and amortization |
| 2,896 |
|
|
| 2,714 |
|
| Share-based compensation expense |
| 562 |
|
|
| 545 |
|
| Deferred income taxes |
| (244 | ) |
|
| (453 | ) |
| Loss/(gain) on sale of assets |
| (215 | ) |
|
| (40 | ) |
| Indefinite-lived intangible asset impairment charge |
| 1,341 |
|
|
| — |
|
| Change in accounts receivable |
| (766 | ) |
|
| (307 | ) |
| Change in inventories |
| (70 | ) |
|
| (119 | ) |
| Change in accounts payable and accrued and other liabilities |
| 1,814 |
|
|
| 313 |
|
| Change in other operating assets and liabilities |
| (1,414 | ) |
|
| (1,107 | ) |
| Other |
| 969 |
|
|
| 564 |
|
|
|
| 19,846 |
|
|
| 16,848 |
|
|
|
|
|
| ||||
| Capital expenditures |
| (3,322 | ) |
|
| (3,062 | ) |
| Proceeds from asset sales |
| 346 |
|
|
| 46 |
|
| Acquisitions, net of cash acquired |
| (21 | ) |
|
| (765 | ) |
| Other investing activity |
| (507 | ) |
|
| 281 |
|
|
|
| (3,504 | ) |
|
| (3,500 | ) |
|
|
|
|
| ||||
| Dividends to shareholders |
| (9,312 | ) |
|
| (8,999 | ) |
| Additions to short-term debt with original maturities of more than three months |
| 3,528 |
|
|
| 17,168 |
|
| Reductions in short-term debt with original maturities of more than three months |
| (7,689 | ) |
|
| (13,031 | ) |
| Net additions/(reductions) to other short-term debt |
| 857 |
|
|
| (3,319 | ) |
| Additions to long-term debt |
| 3,197 |
|
|
| 3,997 |
|
| Reductions of long-term debt |
| (2,335 | ) |
|
| (1,878 | ) |
| Treasury stock purchases |
| (5,006 | ) |
|
| (7,353 | ) |
| Impact of stock options and other |
| 1,905 |
|
|
| 1,269 |
|
|
|
| (14,855 | ) |
|
| (12,146 | ) |
|
|
| (251 | ) |
|
| (170 | ) |
|
|
| 1,235 |
|
|
| 1,032 |
|
|
| $ | 9,482 |
|
| $ | 8,246 |
|
| Amounts in millions of dollars except per share amounts or as otherwise specified. Certain columns and rows may not add due to rounding. | |||||||
|
(Amounts in Millions Except Per Share Amounts)
| |||||
|
|
|
|
| ||
| Cash and cash equivalents | $ | 9,482 |
| $ | 8,246 |
| Accounts receivable |
| 6,118 |
|
| 5,471 |
| Inventories |
| 7,016 |
|
| 7,073 |
| Prepaid expenses and other current assets |
| 2,095 |
|
| 1,858 |
|
|
| 24,709 |
|
| 22,648 |
|
|
| 22,152 |
|
| 21,909 |
|
|
| 40,303 |
|
| 40,659 |
|
|
| 22,047 |
|
| 23,783 |
|
|
| 13,158 |
|
| 11,830 |
|
| $ | 122,370 |
| $ | 120,829 |
|
|
|
|
| ||
| Accounts payable | $ | 15,364 |
| $ | 14,598 |
| Accrued and other liabilities |
| 11,073 |
|
| 10,929 |
| Debt due within one year |
| 7,191 |
|
| 10,229 |
|
|
| 33,627 |
|
| 35,756 |
|
|
| 25,269 |
|
| 24,378 |
|
|
| 6,516 |
|
| 6,478 |
|
|
| 6,398 |
|
| 7,152 |
|
|
| 71,811 |
|
| 73,764 |
|
|
| 50,559 |
|
| 47,065 |
|
| $ | 122,370 |
| $ | 120,829 |
The Procter & Gamble Company
Exhibit 1: Non-GAAP Measures
The following provides definitions of the non-GAAP measures used in Procter & Gamble's July 30, 2024, earnings release and the reconciliation to the most closely related GAAP measure. We believe that these measures provide useful perspective on underlying business trends (i.e., trends excluding non-recurring or unusual items) and results and provide a supplemental measure of period-to-period results. The non-GAAP measures described below are used by management in making operating decisions, allocating financial resources and for business strategy purposes. These measures may be useful to investors, as they provide supplemental information about business performance and provide investors a view of our business results through the eyes of management. These measures are also used to evaluate senior management and are a factor in determining their at-risk compensation. These non-GAAP measures are not intended to be considered by the user in place of the related GAAP measures but rather as supplemental information to our business results. These non-GAAP measures may not be the same as similar measures used by other companies due to possible differences in method and in the items or events being adjusted. The Company is not able to reconcile its forward-looking non-GAAP cash flow and tax rate measures because the Company cannot predict the timing and amounts of discrete items such as acquisition and divestitures, which could significantly impact GAAP results.
The Core earnings measures included in the following reconciliation tables refer to the equivalent GAAP measures adjusted as applicable for the following items:
- Incremental restructuring : The Company has historically had an ongoing level of restructuring activities of approximately $250 - $500 million before tax. On December 5, 2023, the Company announced a limited market portfolio restructuring of its business operations, primarily in certain Enterprise Markets, including Argentina and Nigeria. The adjustment to Core earnings includes the restructuring charges that exceed the normal, recurring level of restructuring charges.
- Intangible asset impairment : In the fiscal year ended June 30, 2024, the Company recognized a non-cash, after-tax impairment charge of $1.0 billion ($1.3 billion before tax) to adjust the carrying value of the Gillette intangible asset acquired as part of the Company's 2005 acquisition of The Gillette Company.
We do not view the above items to be part of our sustainable results, and their exclusion from core earnings measures provides a more comparable measure of year-on-year results. These items are also excluded when evaluating senior management in determining their at-risk compensation.
Organic sales growth : Organic sales growth is a non-GAAP measure of sales growth excluding the impacts of acquisitions and divestitures and foreign exchange from year-over-year comparisons. We believe this measure provides investors with a supplemental understanding of underlying sales trends by providing sales growth on a consistent basis. This measure is used in assessing the achievement of management goals for at-risk compensation.
Core EPS and Currency-neutral EPS: Core net earnings per share, or Core EPS, is a measure of diluted net earnings per common share (diluted EPS) adjusted for items as indicated. Currency-neutral EPS is a measure of the Company's Core EPS excluding the incremental current year impact of foreign exchange. Management views these non-GAAP measures as useful supplemental measures of Company performance over time.
Core gross margin and Currency-neutral Core gross margin : Core gross margin is a measure of the Company's gross margin adjusted for items as indicated. Currency-neutral Core gross margin is a measure of the Company's Core gross margin excluding the incremental current year impact of foreign exchange. Management believes these non-GAAP measures provide a supplemental perspective to the Company’s operating efficiency over time.
Core selling, general and administrative (SG&A) expense as a percentage of sales and Currency-neutral Core SG&A expense as a percentage of sales : Core SG&A expense as a percentage of sales is a measure of the Company's selling, general and administrative expense as a percentage of net sales adjusted for items as indicated. Currency-neutral Core SG&A expense as a percentage of sales is a measure of the Company's Core selling, general and administrative expense as a percentage of net sales excluding the incremental current year impact of foreign exchange. Management believes these non-GAAP measures provides a supplemental perspective to the Company's operating efficiency over time.
Core operating margin and Currency-neutral Core operating margin : Core operating margin is a measure of the Company's operating margin adjusted for items as indicated. Currency-neutral Core operating margin is a measure of the Company's Core operating margin excluding the incremental current year impact of foreign exchange. Management believes these non-GAAP measures provide a supplemental perspective to the Company’s operating efficiency over time.
Adjusted free cash flow : Adjusted free cash flow is defined as operating cash flow less capital spending and excluding payments for the transitional tax resulting from the U.S. Tax Act. Adjusted free cash flow represents the cash that the Company is able to generate after taking into account planned maintenance and asset expansion. We view adjusted free cash flow as an important measure because it is one factor used in determining the amount of cash available for dividends, share repurchases, acquisitions and other discretionary investments.
Adjusted free cash flow productivity : Adjusted free cash flow productivity is defined as the ratio of adjusted free cash flow to net earnings excluding the Gillette indefinite-lived intangible asset impairment charge and non-cash charge for accumulated foreign currency translation losses related to the substantial liquidation of operations in certain Enterprise Markets, including Nigeria. We view adjusted free cash flow productivity as a useful measure to help investors understand P&G’s ability to generate cash. Adjusted free cash flow productivity is used by management in making operating decisions, in allocating financial resources and for budget planning purposes. This measure is also used in assessing the achievement of management goals for at-risk compensation.
| THE PROCTER & GAMBLE COMPANY AND SUBSIDIARIES Reconciliation of Non-GAAP Measures | |||||||||||||||||||
|
|
|
|
| ||||||||||||||||
|
|
|
|
|
|
|
|
|
|
| ||||||||||
| Cost of products sold | $ | 10,348 |
|
| $ | (45 | ) |
| $ | — |
|
| $ | 10,303 |
|
| $ | 10,613 |
|
| Gross profit |
| 10,183 |
|
|
| 45 |
|
|
| — |
|
|
| 10,229 |
|
|
| 9,940 |
|
| Gross margin |
| 49.6 | % |
|
| 0.2 | % |
|
| — | % |
|
| 49.8 | % |
|
| 48.4 | % |
| Currency impact to Core gross margin |
|
|
|
|
|
|
| 0.4 | % |
|
| ||||||||
| Currency-neutral Core gross margin |
|
|
|
|
|
|
| 50.2 | % |
|
| ||||||||
| Selling, general and administrative expense |
| 6,299 |
|
|
| (28 | ) |
|
| — |
|
|
| 6,271 |
|
|
| 5,778 |
|
| Selling, general and administrative expense as a % of net sales |
| 30.7 | % |
|
| (0.2 | )% |
|
| — | % |
|
| 30.5 | % |
|
| 28.1 | % |
| Currency impact to Core selling, general and administrative expense as a % of net sales |
|
|
|
|
|
|
| — | % |
|
| ||||||||
| Currency-neutral Core selling, general and administrative expense as a % of net sales |
|
|
|
|
|
|
| 30.5 | % |
|
| ||||||||
| Operating income |
| 3,884 |
|
|
| 73 |
|
|
| — |
|
|
| 3,958 |
|
|
| 4,162 |
|
| Operating margin |
| 18.9 | % |
|
| 0.4 | % |
|
| — | % |
|
| 19.3 | % |
|
| 20.3 | % |
| Currency impact to Core operating margin |
|
|
|
|
|
|
| 0.4 | % |
|
| ||||||||
| Currency-neutral Core operating margin |
|
|
|
|
|
|
| 19.7 | % |
|
| ||||||||
| Other non-operating income, net |
| 98 |
|
|
| 248 |
|
|
| — |
|
|
| 346 |
|
|
| 195 |
|
| Income taxes |
| 726 |
|
|
| (6 | ) |
|
| — |
|
|
| 720 |
|
|
| 841 |
|
| Net earnings attributable to P&G |
| 3,137 |
|
|
| 327 |
|
|
| — |
|
|
| 3,464 |
|
|
| 3,384 |
|
|
|
|
|
|
|
|
|
|
|
| ||||||||||
| Diluted net earnings per common share | $ | 1.27 |
|
| $ | 0.13 |
|
| $ | — |
|
| $ | 1.40 |
|
| $ | 1.37 |
|
| Currency impact to Core EPS |
| $ | 0.05 |
|
|
| |||||||||||||
| Currency-neutral Core EPS |
| $ | 1.45 |
|
|
| |||||||||||||
| Diluted weighted average common shares outstanding |
| 2,472.2 |
|
|
|
|
|
|
|
|
| 2,477.5 |
| ||||||
| Common shares outstanding - June 30, 2024 |
| 2,357.1 |
|
|
|
|
|
|
|
|
| ||||||||
| For the period ending June 30, 2023, there were no adjustments to or reconciling items for Core EPS. | |||||||||||||||||||
| Diluted net earnings per common share are calculated on Net earnings attributable to Procter & Gamble. | |||||||||||||||||||
|
|
|
|
|
|
|
|
|
|
| ||||||||||
|
|
|
|
|
| |||||||||||||||
| Gross margin |
|
| 120 |
|
| BPS | |||||||||||||
| Core gross margin |
|
| 140 |
|
| BPS | |||||||||||||
| Currency-neutral Core gross margin |
|
| 180 |
|
| BPS | |||||||||||||
| Selling, general and administrative expense as a % of net sales |
|
| 260 |
|
| BPS | |||||||||||||
| Core selling, general and administrative expense as a % of net sales |
|
| 240 |
|
| BPS | |||||||||||||
| Currency-neutral Core selling, general and administrative as a % of net sales |
|
| 240 |
|
| BPS | |||||||||||||
| Operating margin |
|
| (140 | ) |
| BPS | |||||||||||||
| Core operating margin |
|
| (100 | ) |
| BPS | |||||||||||||
| Currency-neutral Core operating margin |
|
| (60 | ) |
| BPS | |||||||||||||
| Diluted EPS |
|
| (7 | )% |
|
| |||||||||||||
| Core EPS |
|
| 2 | % |
|
| |||||||||||||
| Currency-neutral Core EPS |
|
| 6 | % |
|
| |||||||||||||
| THE PROCTER & GAMBLE COMPANY AND SUBSIDIARIES Reconciliation of Non-GAAP Measures | |||||||||||||||||||
|
|
|
|
| ||||||||||||||||
|
|
|
|
|
|
|
|
|
|
| ||||||||||
| Cost of products sold | $ | 40,848 |
|
| $ | (70 | ) |
| $ | — |
|
| $ | 40,778 |
|
| $ | 42,760 |
|
| Gross profit |
| 43,191 |
|
|
| 70 |
|
|
| — |
|
|
| 43,261 |
|
|
| 39,246 |
|
| Gross margin |
| 51.4 | % |
|
| 0.1 | % |
|
| — | % |
|
| 51.5 | % |
|
| 47.9 | % |
| Currency impact to Core gross margin |
|
|
|
|
|
|
| 0.6 | % |
|
| ||||||||
| Currency-neutral Core gross margin |
|
|
|
|
|
|
| 52.1 | % |
|
| ||||||||
| Selling, general and administrative expense |
| 23,305 |
|
|
| (33 | ) |
|
| — |
|
|
| 23,273 |
|
|
| 21,112 |
|
| Selling, general and administrative expense as a % of net sales |
| 27.7 | % |
|
| — | % |
|
| — | % |
|
| 27.7 | % |
|
| 25.7 | % |
| Currency impact to Core selling, general and administrative expense as a % of net sales |
|
|
|
|
|
|
| (0.2 | )% |
|
| ||||||||
| Currency-neutral Core selling, general and administrative expense as a % of net sales |
|
|
|
|
|
|
| 27.5 | % |
|
| ||||||||
| Operating income |
| 18,545 |
|
|
| 103 |
|
|
| 1,341 |
|
|
| 19,988 |
|
|
| 18,134 |
|
| Operating margin |
| 22.1 | % |
|
| 0.1 | % |
|
| 1.6 | % |
|
| 23.8 | % |
|
| 22.1 | % |
| Currency impact to Core operating margin |
|
|
|
|
|
|
| 0.8 | % |
|
| ||||||||
| Currency-neutral Core operating margin |
|
|
|
|
|
|
| 24.6 | % |
|
| ||||||||
| Other non-operating income, net |
| 668 |
|
|
| 248 |
|
|
| — |
|
|
| 916 |
|
|
| 668 |
|
| Income taxes |
| 3,787 |
|
|
| (25 | ) |
|
| 315 |
|
|
| 4,077 |
|
|
| 3,615 |
|
| Net earnings attributable to P&G |
| 14,879 |
|
|
| 376 |
|
|
| 1,026 |
|
|
| 16,281 |
|
|
| 14,653 |
|
|
|
|
|
|
|
|
|
|
|
| ||||||||||
| Diluted net earnings per common share | $ | 6.02 |
|
| $ | 0.15 |
|
| $ | 0.42 |
|
| $ | 6.59 |
|
| $ | 5.90 |
|
| Currency impact to Core EPS |
| $ | 0.23 |
|
|
| |||||||||||||
| Currency-neutral Core EPS |
| $ | 6.82 |
|
|
| |||||||||||||
| Diluted weighted average common shares outstanding |
| 2,471.9 |
|
|
|
|
|
|
|
|
| 2,483.9 |
| ||||||
| Common shares outstanding - June 30, 2024 |
| 2,357.1 |
|
|
|
|
|
|
|
|
| ||||||||
| For the fiscal year ended June 30, 2023, there were no adjustments to or reconciling items for Core EPS. | |||||||||||||||||||
|
|
|
|
|
|
|
|
|
|
| ||||||||||
|
|
|
|
|
| |||||||||||||||
| Gross margin |
|
| 350 |
|
| BPS | |||||||||||||
| Core gross margin |
|
| 360 |
|
| BPS | |||||||||||||
| Currency-neutral Core gross margin |
|
| 420 |
|
| BPS | |||||||||||||
| Selling, general and administrative expense as a % of net sales |
|
| 200 |
|
| BPS | |||||||||||||
| Core selling, general and administrative expense as a % of net sales |
|
| 200 |
|
| BPS | |||||||||||||
| Currency-neutral Core selling, general and administrative as a % of net sales |
|
| 180 |
|
| BPS | |||||||||||||
| Operating margin |
|
| — |
|
| BPS | |||||||||||||
| Core operating margin |
|
| 170 |
|
| BPS | |||||||||||||
| Currency-neutral Core operating margin |
|
| 250 |
|
| BPS | |||||||||||||
| Diluted EPS |
|
| 2 | % |
|
| |||||||||||||
| Core EPS |
|
| 12 | % |
|
| |||||||||||||
| Currency-neutral Core EPS |
|
| 16 | % |
|
| |||||||||||||
Organic sales growth :
The reconciliation of reported sales growth to organic sales is as follows:
|
|
|
|
|
|
|
|
|
| Beauty | (1)% |
| 3% |
| 1% |
| 3% |
| Grooming | —% |
| 7% |
| —% |
| 7% |
| Health Care | 3% |
| 1% |
| —% |
| 4% |
| Fabric & Home Care | —% |
| 1% |
| 1% |
| 2% |
| Baby, Feminine & Family Care | (3)% |
| 2% |
| —% |
| (1)% |
|
|
|
|
|
|
|
|
|
|
| Acquisition & Divestiture Impact/Other includes the volume and mix impact of acquisitions and divestitures and rounding impacts necessary to reconcile net sales to organic sales. | |
|
|
|
|
|
|
|
|
|
|
|
|
|
|
|
|
|
|
|
| Other includes the sales mix impact from acquisitions and divestitures and rounding impacts necessary to reconcile volume to net sales. | |
|
|
|
|
|
|
|
|
| FY 2025 (Estimate) |
| +2% to +4% |
| +1% |
| +3% to +5% |
Core EPS growth :
|
|
|
|
|
|
|
|
| FY 2025 (Estimate) |
| +10% to +12% |
| -5% |
| +5% to +7% |
|
| Includes the impact of Gillette indefinite-lived intangible asset impairment charge and incremental non-core restructuring charges incurred in fiscal 2024 and expected impact of a non-cash charge of approximately $750 million for accumulated foreign currency translation losses in the first quarter of the fiscal year ended June 30, 2025 | |
Adjusted free cash flow (dollars in millions) :
|
| ||||
|
|
|
|
|
|
| $5,754 |
| $(783) |
| $4,971 |
|
| ||||||
|
|
|
|
|
|
|
|
| $19,846 |
| $(3,322) |
| $422 |
| $16,946 |
Adjusted free cash flow productivity (dollars in millions) :
|
| ||||||||
|
|
|
|
|
|
|
|
|
|
| $4,971 |
| $3,144 |
| $216 |
| $3,360 |
| 148% |
|
| Adjustments to Net Earnings relate to non-cash charge for accumulated foreign currency translation losses due to the substantial liquidation of operations in certain Enterprise Markets, including Nigeria. | |
|
| ||||||||
|
|
|
|
|
|
|
|
|
|
| $16,946 |
| $14,974 |
| $1,242 |
| $16,216 |
| 105% |
|
| Adjustments to Net Earnings relate to the Gillette indefinite-lived intangible asset impairment charge ($1.0 billion) and non-cash charge for accumulated foreign currency translation losses ($216) due to the substantial liquidation of operations in certain Enterprise Markets, including Nigeria. | |
Category: PG-IR
P&G Media : Wendy Kennedy, 513.780.7212 Jennifer Corso, 513.983.2570
P&G Investor Relations : John Chevalier, 513.983.9974
Mastering the Art of Presenting Data in PowerPoint

Presenting data in PowerPoint is easy. However, making it visually appealing and effective takes more time and effort. It’s not hard to bore your audience with the same old data presentation formats. So, there is one simple golden rule: Make it not boring.
When used correctly, data can add weight, authority, and punch to your message. It should support and highlight your ideas, making a concept come to life. But this begs the question: How to present data in PowerPoint?
After talking to our 200+ expert presentation designers, I compiled information about their best-kept secrets to presenting data in PowerPoint.
Below, I’ll show our designers ' favorite ways to add data visualization for global customers and their expert tips for making your data shine. Read ahead and master the art of data visualization in PowerPoint!

Feel free to explore sections to find what's most useful!
How to present data in PowePoint: a step-by-step guide
Creative ways to present data in powerpoint.
- Tips for data visualization
Seeking to optimize your presentations? – 24Slides designers have got you covered!
How you present your data can make or break your presentation. It can make it stand out and stick with your audience, or make it fall flat from the go.
It’s not enough to just copy and paste your data into a presentation slide. Luckily, PowerPoint has many smart data visualization tools! You only need to put in your numbers, and PowerPoint will work it up for you.
Follow these steps, and I guarantee your presentations will level up!
1. Collect your data
First things first, and that is to have all your information ready. Especially for long business presentations, there can be a lot of information to consider when working on your slides. Having it all organized and ready to use will make the whole process much easier to go through.
Consider where your data comes from, whether from research, surveys, or databases. Make sure your data is accurate, up-to-date, and relevant to your presentation topic.
Your goal will be to create clear conclusions based on your data and highlight trends.

2. Know your audience
Knowing who your audience is and the one thing you want them to get from your data is vital. If you don’t have any idea where to start, you can begin with these key questions:
- What impact do you want your data to make on them?
- Is the subject of your presentation familiar to them?
- Are they fellow sales professionals?
- Are they interested in the relationships in the data you’re presenting?
By answering these, you'll be able to clearly understand the purpose of your data. As a storyteller, you want to capture your audience’s attention.
3. Choose a data visualization option
One key to data visualization in PowerPoint is being aware of your choices and picking the best one for your needs. This depends on the type of data you’re trying to showcase and your story.
When showcasing growth over time, you won’t use a spider chart but a line chart. If you show percentages, a circle graph will probably work better than a timeline. As you can see, knowing how to work with charts, graphs, and tables can level up your presentation.
Later, we’ll review some of the most common tools for data visualization in PowerPoint. This will include what these graphs and charts are best for and how to make the most of each. So read ahead for more information about how to present data in PowerPoint!

4. Be creative!
PowerPoint can assist with creating graphs and charts, but it's up to you to perfect them. Take into account that PowerPoint has many options. So, don't be afraid to think outside the box when presenting your data.
To enhance your presentation design, try out different color schemes, fonts, and layouts. Add images, icons, and visual elements to highlight your ideas.
If this sounds complicated to you, there's no need to worry. At the end of this article, you’ll find some easy tips for upgrading your data visualization design!
At this point, you might wonder: what is the best way to present data in PowerPoint? Well, let me tell you: it's all about charts. To accomplish a polished presentation, you must use charts instead of words. When visualizing quantitative data, a picture is worth a thousand words.
Based on +10 years of expertise, we've identified key chart types and creative ways to work with them. Let's delve into each one!
Line Charts
Line charts are a classic, which can make them boring. However, if done correctly, they can be striking and effective. But where does their popularity come from? Here's the answer: Line charts work great to show changes over time.
Another critical difference is that line charts are accumulative. For example, you can join them to a column chart to show different data at a glance. They allow data visualization effectively, making it easier to figure out.
To make the most of them, mastering how to work with line charts is essential. But there is good news: you will have a lot of freedom to customize them!

Download our Free Line Chart Template here .
Bar and column charts
Bar and column charts are another classic choice. Again, they are simple and great for comparing different categories. They organize them around two axes: one shows numbers, and the other shows what we want to compare.
But when should you use a bar chart or a column chart? A bar chart is better when comparing different categories and having long labels. A column chart, on the other hand, is better if you have a few categories and want to show changes over time.
You also have the waterfall option, which is perfect for highlighting the difference between gains and losses. It also adds a dynamic touch to your presentation!
Unsure how to implement these charts? Here's how to add a bar or a column chart in PowerPoint.

Download our Bar and Column Chart Template here .
Venn diagram
Venn diagrams are definitely something to consider when discussing data visualization—even if its focus is not quantitative data! Venn diagrams are best for showcasing similarities and differences between two (or more) categories or products.
By using overlapping circles, you can quickly and easily see common features between separate ideas. The shared space of the circles shows what is the same between the groups. However, items in the outer parts of each circle show what isn’t a common trait.
They make complex relationships easy to understand. Now, you only need to know how to create a Venn diagram in PowerPoint —quite simple!

Download our Free Venn Diagram Template here .
Pie charts are a great way to show different percentages of a whole. They immediately identify the largest and smallest values. This means that they are great options for drawing attention to differences between one group and another.
However, many people misuse pie charts by overpacking them. As a rule, keep the chart to six or fewer sections. That way, the data is striking, not confusing. Then, make the pie chart your own with small, individual details and designs.
Once again, the powerful presentation of data is in simplicity.
Are you considering incorporating it into your presentation? Here’s how to easily add a pie chart in PowerPoint.

Download our Free Pie Chart Template here .
Bubble Charts
Bubble charts playfully present data in an incredibly visual way. But, what makes them so unique? It's easy: they show different values through varying circle sizes.
Squeezed together, the circles also show a holistic viewpoint. Bigger bubbles catch the eye, while small bubbles illustrate how the data breaks down into smaller values. ¿The result? A presentation of data in a visual form.
It can be one of the most graphic ways to represent the spending distribution. For example, you can instantly see your biggest costs or notice how important finances are getting lost in a sea of bubbles. This quick analysis can be incredibly handy.

Download our Free Bubble Chart Template here .
Maps are the go-to solution for presenting geographic information . They help put data in a real-world context. You usually take a blank map and use color for the important areas.
Blocks, circles, or shading represent value. Knowing where certain data is can be crucial. A consistent color scheme makes it easy to show how valuable each section is.
They also work great when paired with other forms of data visualization. For example, you can use pie charts to provide information about offices in different cities around the world or bar charts to compare revenue in different locations.

Download our Free World Map Template here .
If you want to display chronological data, you must use a timeline. It’s the most effective and space-efficient way to show time passage.
They make it easy for your audience to understand the sequence of events with clear and concise visuals.
You can use timelines to show your company’s history or significant events that impacted your business. Like maps, you can easily mix them with other types of data visuals. This characteristic allows you to create engaging presentations that tell a comprehensive story.
At this point, it's a matter of understanding how to add a timeline correctly in PowerPoint . Spoiler: it's incredibly easy.

Download our Free Timeline Chart Template here .
Flowcharts, like timelines, represent a succession of events. The main difference is that timelines have determined start and finish points and specific dates. Flowcharts, on the other hand, show the passing from one step to the next.
They are great for showing processes and info that need to be in a specific order. They can also help you communicate cause-and-effect information in a visually engaging way.
Their best feature is that (unlike timelines) they can also be circular, meaning this is a recurrent process. All you need now is to become familiar with creating a flowchart in PowerPoint .

Download our Free Flowchart Template here .
5 Tips for data visualization in PowerPoint
Knowing how to present data in PowerPoint presentations is not hard, but it takes time to master it. After all, practice makes perfect!
I've gathered insights from our 200+ expert designers , and here are the top five tips they suggest for enhancing your data presentations!
1. Keep it simple
Don’t overload your audience with information. Let the data speak for itself. If you write text below a chart, keep it minimalist and highlight the key figures. The important thing in a presentation is displaying data in a clear and digestible way.
Put all the heavy facts and figures in a report, but never on a PowerPoint slide.
You can even avoid charts altogether to keep it as simple as possible. And don't get me wrong. We've already covered that charts are the way to go for presenting data in PowerPoint, but there are a few exceptions.
This begs the question: when shouldn't you use charts in PowerPoint? The answer is quite short. If your data is simple or doesn't add much value to your presentation, you might want to skip using charts.
2. Be original
One of the best ways to make your data impactful is originality. Take time to think about how you could present information uniquely. Think of a whole new concept and play around with it. Even if it’s not yet perfect, people will appreciate the effort to be original.
Experiment with creative ways to present your data, adding storytelling techniques , unique design elements, or interactive features. This approach can make the data more appealing and captivating for your audience.
You can even mix up how to present data in PowerPoint. Instead of just one format, consider using two different types of data presentation on a single slide. For instance, try placing a bar chart on the left and a pie chart showcasing different data on the right.
3. Focus on your brand
Keeping your presentation on-brand can genuinely make you stand out from the crowd! Even if you just focus on your brand’s color scheme, it will make your presentation look more polished and professional.
Have fun experimenting with data visualization tools to ensure they match your company’s products and services. What makes you different from others?
Add your brand's style into your visualization to ensure brand consistency and recognition. Use colors, fonts, and logos aligned with your company's image.
You can even make a presentation that more subtly reflects your brand. Think of what values you want to associate with your company and how you can display these in your presentation design.

4. Highlight key information
Not distracting your audience nicely brings us to our third point: Highlight key information. Being detailed and informative is important, but grabbing and keeping the audience's attention is crucial.
Presenting numbers in PowerPoint can be difficult, but it doesn’t must be. Make your audience listen to the bigger message of your words, not just the exact details. All the smaller particulars can be confirmed later.
Your listeners don’t want to know the facts and figures to the nearest decimal. They want the whole number, which is easy to spot and understand.
The meaning of the number is more important than its numerical value. Is it high or low? Positive or negative? Good or bad for business? These are the questions to which you want the answers to be clear.
Using colors is an excellent way to work with this. Colors are also a great visual tool to showcase contrast. For example, when you're working on a graph to display your revenue, you can showcase expenses in red and earnings in green. This kind of color-coding will make your data visualization clear from first sight!
5. Use Templates!
Presentation templates can be your best friend when you want to present data effectively in PowerPoint.
They offer pre-designed layouts and styles that can ensure consistency throughout your presentation. Templates allow you to adjust colors, fonts, and layouts to match your branding or personal preferences.
Microsoft Office has its own library of templates, but you can also find some pretty amazing ones online. Take some extra time to search and pick one that truly fits your needs and brand.
¿The good news? Our Templates by 24Slides platform has hundreds of PowerPoint chart templates, all completely free for you to use . You can even download different templates and mix and match slides to make the perfect deck. All are entirely editable, so you can add your own data and forget about design.
If you liked the look of some examples in this article, you might be in luck! Most are part of these, and you can also find them on our Templates platform.
In this article, I've shown why knowing how to present data efficiently in PowerPoint is crucial. Data visualization tools are a must to ensure your message is clear and that it sticks with your audience.
However, achieving results that really stand out could be a huge challenge for beginners. So, If you want to save time and effort on the learning curve of presenting data in PowerPoint, you can always trust professionals!
With 10+ years of experience and more than 200 designers worldwide, we are the world’s largest presentation design company across the globe.
24Slides' professional PowerPoint designers work with businesses worldwide, helping them transform their presentations from ‘okay’ to ‘spectacular.’ With each presentation, we're crafting a powerful tool to captivate audiences and convey messages effectively!

Looking to boost your PowerPoint game? Check out this content:
- PowerPoint 101: The Ultimate Guide for Beginners
- How to Create the Perfect B2B Sales Presentation
- The Ultimate Brand Identity Presentation Guide [FREE PPT Template]
- 7 Essential Storytelling Techniques for your Business Presentation
- The Cost of PowerPoint Presentations: Discover the hidden expenses you might overlook!
Create professional presentations online
Other people also read

How To Write Effective Emails That Will Improve Your Communi...
How to Make a Marketing Plan Presentation in PowerPoint

Alternative presentation styles: Takahashi

- The Power of mRNA
- Responsibility
News Details
Moderna reports second quarter 2024 financial results and provides business updates.
Reports second quarter revenues of $241 million, GAAP net loss of $1.3 billion and GAAP EPS of $(3.33)
Updates 2024 financial framework and revises expectations for product sales to $3.0 to $3.5 billion
Received U.S. FDA approval for RSV vaccine, mRESVIA, and began shipping in July; received EMA positive opinion in June
Announced positive Phase 3 data for combination vaccine against influenza and COVID-19
Announced positive Phase 3 data for next-generation COVID-19 vaccine
CAMBRIDGE, MA / ACCESSWIRE / August 1, 2024 / Moderna, Inc. (NASDAQ:MRNA) today reported financial results and provided business updates for the second quarter of 2024.
"During the second quarter, we marked the approval of our second mRNA product and significantly lowered our operating costs. We remain focused on execution for the 2024-25 COVID season and the launch of our RSV vaccine in the U.S.," said Stéphane Bancel, Chief Executive Officer of Moderna. "With continued positive Phase 3 data across our respiratory portfolio, we are using our mRNA platform to address significant unmet medical needs and advance public health. Our platform is poised to reach millions globally this year and we are excited by its continued positive impact on patients."
Recent progress includes:
Commercial Updates
COVID - 19: The Company reported $184 million in Spikevax® (COVID-19 vaccine) sales in the second quarter of 2024, which includes $162 million of U.S. sales and $22 million of international sales.
Contracting is mostly complete in a highly competitive COVID market. Moderna is ready for the upcoming vaccination season with ample and timely supply. In the U.S., the majority of contracts are finalized and Moderna's focus is on working with public health officials, health care providers and pharmacies to drive vaccination coverage rates to reduce the substantial burden of COVID-19. In the European Union (EU), Moderna is negotiating a tender framework agreement to provide market access; however, based on recent discussions, the Company now expects very low EU sales in 2024. In the Rest of World, the Company has multiple signed contracts in place, with some potential revenue deferrals into 2025.
RSV: Following U.S. Food and Drug Administration (FDA) approval in May and the Advisory Committee on Immunization Practices (ACIP) recommendation in June, Moderna's RSV vaccine, mRESVIA®, has launched in the U.S. and deliveries are underway as of July 2024. The Company is targeting the pharmacy segment in the U.S. and its commercial focus is on reaching vaccinators in a highly competitive market. Additionally, the European Medicines Agency (EMA) has adopted a positive opinion recommending marketing authorization in the EU for mRESVIA.
Second Quarter 2024 Financial Results
Revenue: Total revenue for the second quarter of 2024 was $241 million, compared to $344 million in the same period in 2023. This decline was primarily attributable to decreased sales of the Company's COVID-19 vaccine. Net product sales for the second quarter of 2024 were $184 million, reflecting a 37% decrease compared to the same period in 2023. This reduction aligns with the expected shift to a seasonal COVID-19 vaccine market, with higher demand anticipated in the fall and winter. In the prior year period, product sales were largely recognized from doses delivered and deferred from 2022.
Cost of Sales: Cost of sales for the second quarter of 2024 was $115 million, which included third-party royalties of $10 million, unutilized manufacturing capacity and wind-down costs of $55 million, and inventory write-downs of $14 million. Compared to the same period in 2023, the cost of sales decreased by $616 million, or 84%. Cost of sales as a percentage of net product sales was 62% for the second quarter of 2024, down from 249% in the second quarter of 2023. The reduction in cost of sales was primarily due to a lower sales volume and decreased unutilized manufacturing capacity, inventory write-downs, and losses on firm purchase commitments and related cancellation fees. The reduction in cost of sales as a percentage of net product sales in 2024 was mainly driven by lower costs, partially offset by the reduced sales volume, reflecting a decline in product demand and increased product seasonality.
Research and Development Expenses: Research and development expenses for the second quarter of 2024 increased by 6% to $1.2 billion, compared to the second quarter in 2023. This increase was mainly due to higher personnel-related costs, driven by an increased headcount to support ongoing research and development efforts. Research and development expenses for the quarter also include the purchase of a priority review voucher. The increase was partly offset by a decrease in clinical development and manufacturing expenses, resulting from lower spending on clinical trials for the Company's COVID-19 and seasonal flu programs, in line with its planned trial schedules.
Selling, General and Administrative Expenses: Selling, general and administrative expenses for the second quarter of 2024 decreased by 19% to $268 million, compared to the second quarter in 2023. This decrease is a result of cost discipline and the efficiencies resulting from investments the Company made in foundational capabilities over the last year, which allowed for a significant reduction of purchased services and the use of external consultants. The Company continues to invest in digital and commercial capabilities and has intensified its focus on building and utilizing AI technologies to further streamline operations and enhance productivity.
Income Taxes: The Company did not recognize an income tax expense for the second quarter of 2024, in contrast to an income tax benefit of $369 million in the same period last year. The shift primarily resulted from the continued application of a valuation allowance on the majority of the Company's deferred tax assets, first established in the third quarter of 2023. The Company only maintained a valuation allowance on certain state deferred tax assets prior to the third quarter of 2023.
Net Loss: Net loss was $(1.3) billion for the second quarter of 2024, compared to $(1.4) billion for the second quarter of 2023.
Net Loss Per Share: Net loss per share was $(3.33) for the second quarter of 2024, compared to $(3.62) for the second quarter of 2023.
Cash Position: Cash, cash equivalents and investments as of June 30, 2024, were $10.8 billion, compared to $12.2 billion as of March 31, 2024. The decrease in the cash position during the second quarter of 2024 was largely attributable to research and development expenses and operating activities.
2024 Financial Framework
Net Sales: The Company revises its 2024 expected net product sales to $3.0 to $3.5 billion from its respiratory franchise. For the second half of the year, it expects a sales split of 40-50% in the third quarter with the balance in the fourth quarter of 2024, subject to the timing of regulatory approvals. The update in product sales is driven by three primary factors: very low EU sales in 2024, potential revenue deferrals for certain international sales into 2025, and an increasingly competitive environment for respiratory vaccines in the U.S.
Cost of Sales: Cost of sales is expected to be in the range of 40-50% of product sales for the year.
Research and Development Expenses: Full-year 2024 research and development expenses are anticipated to be approximately $4.5 billion.
Selling, General and Administrative Expenses: Selling, general and administrative expenses for 2024 are projected to be approximately $1.3 billion.
Income Taxes: The Company continues to expect its full-year tax expense to be negligible.
Capital Expenditures: Capital expenditures for 2024 are expected to be approximately $0.9 billion.
Cash and Investments: Year-end cash and investments for 2024 are projected to be approximately $9 billion.
Recent Progress and Upcoming Late-Stage Pipeline Milestones
Respiratory vaccines:
Respiratory syncytial virus (RSV) vaccine : After Moderna received U.S. FDA approval for its RSV vaccine (mRNA-1345), ACIP issued a recommendation for all unvaccinated people 75 years of age and older and unvaccinated people ages 60-74 who are at increased risk for RSV to receive the vaccine for the prevention of RSV-associated lower respiratory tract disease (RSV-LRTD) and acute respiratory disease (ARD). Additionally, the EMA adopted a positive opinion recommending marketing authorization in the EU for mRESVIA. The Company is awaiting regulatory approvals in additional countries.
Seasonal flu vaccine : Moderna's seasonal flu vaccine (mRNA-1010) demonstrated consistently acceptable safety and tolerability across three Phase 3 trials. The Company is engaging with regulators and intends to file in 2024 .
Next-generation COVID-19 vaccine : A recent announcement of positive interim results from the NEXTCove Phase 3 trial showed that Moderna's next-generation COVID-19 vaccine (mRNA-1283) has met its primary efficacy endpoint, demonstrating non-inferior vaccine efficacy against COVID-19 compared to Spikevax (mRNA-1273) in participants 12 years of age and older. Higher efficacy was also observed compared to Spikevax in adults 18 years of age and older. The Company is engaging with regulators and intends to file in 2024.
Seasonal flu + COVID vaccine : Moderna recently announced the Phase 3 trial of its combination vaccine against seasonal flu and COVID-19 (mRNA-1083) has met its primary endpoints, eliciting higher immune responses against influenza virus and SARS-CoV-2 than licensed flu and COVID vaccines in adults 50 years and older, including an enhanced influenza vaccine in adults 65 years and older. The Company is engaging with regulators on next steps.
Oncology therapeutics:
Individualized Neoantigen Therapy (INT) : Moderna and Merck announced additional 3-year data for mRNA-4157 in combination with KEYTRUDA® (pembrolizumab), demonstrating sustained improvement in recurrence-free survival and distant metastasis-free survival versus KEYTRUDA in patients with high-risk stage III/IV melanoma following complete resection. At a median planned follow-up of the Phase 2b study at 34.9 months, mRNA-4157 in combination with KEYTRUDA reduced the risk of recurrence or death by 49% and the risk of distant metastasis or death by 62% compared to KEYTRUDA alone in these patients. The 2.5-year recurrence-free survival rate of mRNA-4157 in combination with KEYTRUDA was 74.8% as compared to 55.6% for KEYTRUDA alone, with the benefit observed across exploratory subgroups.
Rare disease therapeutics:
Methylmalonic acidemia (MMA) therapeutic : Moderna's investigational therapeutic for MMA (mRNA-3705) has been selected by the U.S. FDA for the Support for Clinical Trials Advancing Rare Disease Therapeutics (START) pilot program. mRNA-3705 was chosen by the Center for Biologics Evaluation and Research (CBER) as one of four investigational medicines for accelerated development to address unmet medical needs for rare diseases. The Company expects to advance its MMA program into a registrational study in 2024 .
Moderna Corporate Updates
Announced that David M. Rubenstein, Co-Founder and Co-Chairman of The Carlyle Group, will join Moderna's Board of Directors, effective August 5, 2024, when directors Robert Langer and Stephen Berenson will retire from the Board.
Entered into an agreement with Mitsubishi Tanabe Pharma Corporation to promote Moderna's mRNA respiratory vaccine portfolio in Japan.
Received a project award of $176 million through BARDA's Rapid Response Partnership Vehicle Consortium to accelerate the development of an mRNA-based pandemic influenza vaccine.
Published third annual ESG Report, Impacting Human Health, on June 25, 2024.
Company Accolades
Moderna was named to the Boston Business Journal 's annual list of the Most Charitable Companies in Massachusetts (second consecutive year)
Moderna was recognized as a top-scoring company on Disability:IN's Disability Equality Index and a Best Place to Work for Disability Inclusion (third consecutive year)
Moderna was recognized as a Great Place to Work in the U.S. by Great Place To Work® (second consecutive year)
Key 2024 Investor and Analyst Event Dates
R&D Day: September 12
Investor Call and Webcast Information
Moderna will host a live conference call and webcast at 8:00 a.m. ET on August 1, 2024. To access the live conference call via telephone, please register at the link below. Once registered, dial-in numbers and a unique pin number will be provided. A live webcast of the call will also be available under "Events and Presentations" in the Investors section of the Moderna website.
Telephone: https://register.vevent.com/register/BI2ef72dcc8f6e4477bf2f61ab92054abb
Webcast: https://investors.modernatx.com
The archived webcast will be available on Moderna's website approximately two hours after the conference call and will be available for one year following the call.
About Moderna
Moderna is a leader in the creation of the field of mRNA medicine. Through the advancement of mRNA technology, Moderna is reimagining how medicines are made and transforming how we treat and prevent disease for everyone. By working at the intersection of science, technology and health for more than a decade, the company has developed medicines at unprecedented speed and efficiency, including one of the earliest and most effective COVID-19 vaccines.
Moderna's mRNA platform has enabled the development of therapeutics and vaccines for infectious diseases, immuno-oncology, rare diseases and autoimmune diseases. With a unique culture and a global team driven by the Moderna values and mindsets to responsibly change the future of human health, Moderna strives to deliver the greatest possible impact to people through mRNA medicines. For more information about Moderna, please visit modernatx.com and connect with us on X (formerly Twitter), Facebook, Instagram, YouTube and LinkedIn.
MODERNA, INC. CONDENSED CONSOLIDATED STATEMENTS OF OPERATIONS (Unaudited, in millions, except per share data)
|
|
|
|
|
| |||||||||||
|
|
|
|
|
|
|
|
|
|
|
| |||||
|
|
|
|
|
|
|
|
|
|
|
| |||||
| $ | 184 |
|
| $ | 293 |
|
| $ | 351 |
|
| $ | 2,121 |
| |
|
| 57 |
|
|
| 51 |
|
|
| 57 |
|
|
| 85 |
| |
|
| 241 |
|
|
| 344 |
|
|
| 408 |
|
|
| 2,206 |
| |
|
|
|
|
|
|
|
|
|
|
|
|
|
|
|
| |
|
| 115 |
|
|
| 731 |
|
|
| 211 |
|
|
| 1,523 |
| |
|
| 1,221 |
|
|
| 1,148 |
|
|
| 2,284 |
|
|
| 2,279 |
| |
|
| 268 |
|
|
| 332 |
|
|
| 542 |
|
|
| 637 |
| |
|
| 1,604 |
|
|
| 2,211 |
|
|
| 3,037 |
|
|
| 4,439 |
| |
|
| (1,363 | ) |
|
| (1,867 | ) |
|
| (2,629 | ) |
|
| (2,233 | ) | |
|
| 111 |
|
|
| 104 |
|
|
| 231 |
|
|
| 213 |
| |
|
| (27 | ) |
|
| 14 |
|
|
| (46 | ) |
|
| (34 | ) | |
|
| (1,279 | ) |
|
| (1,749 | ) |
|
| (2,444 | ) |
|
| (2,054 | ) | |
|
| - |
|
|
| (369 | ) |
|
| 10 |
|
|
| (753 | ) | |
| $ | (1,279 | ) |
| $ | (1,380 | ) |
| $ | (2,454 | ) |
| $ | (1,301 | ) | |
|
|
|
|
|
|
|
|
|
|
|
|
|
|
|
| |
|
|
|
|
|
|
|
|
|
|
|
|
|
|
|
| |
| $ | (3.33 | ) |
| $ | (3.62 | ) |
| $ | (6.41 | ) |
| $ | (3.39 | ) | |
|
|
|
|
|
|
|
|
|
|
|
|
|
|
|
| |
|
|
|
|
|
|
|
|
|
|
|
|
|
|
|
| |
|
| 384 |
|
|
| 381 |
|
|
| 383 |
|
|
| 383 |
| |
1 Includes grant, collaboration and licensing and royalty revenue
MODERNA, INC. CONDENSED CONSOLIDATED BALANCE SHEETS (Unaudited, in millions)
|
|
|
|
|
| |||
|
|
|
|
|
| |||
|
|
|
|
|
| |||
|
|
|
|
|
| |||
| $ | 2,478 |
|
| $ | 2,907 |
| |
|
| 6,010 |
|
|
| 5,697 |
| |
|
| 163 |
|
|
| 892 |
| |
|
| 399 |
|
|
| 202 |
| |
|
| 611 |
|
|
| 627 |
| |
|
| 9,661 |
|
|
| 10,325 |
| |
|
| 2,326 |
|
|
| 4,677 |
| |
|
| 2,196 |
|
|
| 1,945 |
| |
|
| 775 |
|
|
| 713 |
| |
|
| 81 |
|
|
| 81 |
| |
|
| 641 |
|
|
| 685 |
| |
| $ | 15,680 |
|
| $ | 18,426 |
| |
|
|
|
|
|
|
|
| |
|
|
|
|
|
|
|
| |
| $ | 279 |
|
| $ | 520 |
| |
|
| 1,333 |
|
|
| 1,798 |
| |
|
| 702 |
|
|
| 568 |
| |
|
| 7 |
|
|
| 63 |
| |
|
| 42 |
|
|
| 66 |
| |
|
| 2,363 |
|
|
| 3,015 |
| |
|
| 95 |
|
|
| 83 |
| |
|
| 668 |
|
|
| 643 |
| |
|
| 576 |
|
|
| 575 |
| |
|
| 266 |
|
|
| 256 |
| |
|
| 3,968 |
|
|
| 4,572 |
| |
|
|
|
|
|
|
|
| |
|
| 631 |
|
|
| 371 |
| |
|
| (71 | ) |
|
| (123 | ) | |
|
| 11,152 |
|
|
| 13,606 |
| |
|
| 11,712 |
|
|
| 13,854 |
| |
| $ | 15,680 |
|
| $ | 18,426 |
| |
MODERNA, INC. CONDENSED CONSOLIDATED STATEMENTS OF CASH FLOWS (Unaudited, in millions)
|
|
| ||||||
|
|
|
|
|
| |||
|
|
|
|
|
| |||
| $ | (2,454 | ) |
| $ | (1,301 | ) | |
|
|
|
|
|
|
|
| |
|
| 213 |
|
|
| 149 |
| |
|
| 77 |
|
|
| 170 |
| |
|
| (55 | ) |
|
| (29 | ) | |
|
| 35 |
|
|
| (17 | ) | |
|
| - |
|
|
| (530 | ) | |
|
| 7 |
|
|
| (12 | ) | |
|
|
|
|
|
|
|
| |
|
| 729 |
|
|
| 1,153 |
| |
|
| 3 |
|
|
| (142 | ) | |
|
| (197 | ) |
|
| 234 |
| |
|
| (62 | ) |
|
| (9 | ) | |
|
| (199 | ) |
|
| (187 | ) | |
|
| (464 | ) |
|
| (633 | ) | |
|
| 146 |
|
|
| (979 | ) | |
|
| (56 | ) |
|
| (1 | ) | |
|
| 25 |
|
|
| 12 |
| |
|
| (11 | ) |
|
| (18 | ) | |
|
| (2,263 | ) |
|
| (2,140 | ) | |
|
|
|
|
|
|
|
| |
|
| (3,390 | ) |
|
| (1,281 | ) | |
|
| 3,536 |
|
|
| 3,264 |
| |
|
| 1,999 |
|
|
| 2,427 |
| |
|
| (378 | ) |
|
| (347 | ) | |
|
| - |
|
|
| (85 | ) | |
|
| - |
|
|
| (23 | ) | |
|
| 1,767 |
|
|
| 3,955 |
| |
|
|
|
|
|
|
|
| |
|
| 47 |
|
|
| 25 |
| |
|
| - |
|
|
| (1,154 | ) | |
|
| 1 |
|
|
| (81 | ) | |
|
| 48 |
|
|
| (1,210 | ) | |
|
| (448 | ) |
|
| 605 |
| |
|
| 2,928 |
|
|
| 3,217 |
| |
| $ | 2,480 |
|
| $ | 3,822 |
| |
Spikevax® and mRESVIA® are registered trademarks of Moderna.
KEYTRUDA® is a registered trademark of Merck Sharp & Dohme Corp.
Forward-Looking Statements
This press release contains forward-looking statements within the meaning of the Private Securities Litigation Reform Act of 1995, as amended, including statements regarding: Moderna's anticipated approval and launch of its updated COVID-19 and RSV vaccines and related market dynamics; Moderna's 2024 financial framework and anticipated performance, including expected revenues; and anticipated milestones for Moderna's pipeline programs in 2024. In some cases, forward-looking statements can be identified by terminology such as "will," "may," "should," "could," "expects," "intends," "plans," "aims," "anticipates," "believes," "estimates," "predicts," "potential," "continue," or the negative of these terms or other comparable terminology, although not all forward-looking statements contain these words. The forward-looking statements in this press release are neither promises nor guarantees, and you should not place undue reliance on these forward-looking statements because they involve known and unknown risks, uncertainties, and other factors, many of which are beyond Moderna's control and which could cause actual results to differ materially from those expressed or implied by these forward-looking statements. These risks, uncertainties, and other factors include, among others, those risks and uncertainties described under the heading "Risk Factors" in Moderna's Annual Report on Form 10-K for the fiscal year ended December 31, 2023, filed with the U.S. Securities and Exchange Commission (SEC), and in subsequent filings made by Moderna with the SEC, which are available on the SEC's website at www.sec.gov . Except as required by law, Moderna disclaims any intention or responsibility for updating or revising any forward-looking statements contained in this press release in the event of new information, future developments or otherwise. These forward-looking statements are based on Moderna's current expectations and speak only as of the date of this press release.
Moderna Contacts
Media: Chris Ridley Head of Global Media Relations +1 617-800-3651 [email protected]
Investors: Lavina Talukdar Senior Vice President & Head of Investor Relations +1 617-209-5834 [email protected]
SOURCE: Moderna, Inc.
Quick Links
- SEC Filings
- Investor FAQs
- Information Request Form
Investor Email Alerts
To opt-in for investor email alerts, please enter your email address in the field below and select at least one alert option. After submitting your request, you will receive an activation email to the requested email address. You must click the activation link in order to complete your subscription. You can sign up for additional alert options at any time.
At Moderna, we promise to treat your data with respect and will not share your information with any third party. You can unsubscribe to any of the investor alerts you are subscribed to by visiting the ‘unsubscribe’ section below. If you experience any issues with this process, please contact us for further assistance.
By providing your email address below, you are providing consent to Moderna to send you the requested Investor Email Alert updates.
| * |
| * | |||||||||||||||||||||||||||||||||||||||||||||||||||||||||||||||||||||||||||||||||||||||||||||||||||||||||||||||||||||||||||||||||||||||||||||||||||||||||||||||||||||||||||||||||||||||||||||||||||||||||||||||||||||||||||||||||||||||||||||||||||||||||||||||||||||||||||||||||||||||||||||||||||||||||||||||||||||||||||||||||||||||||||||||||||||||||||||||||||||||||||||||||||||||||||||||||||||||||||||||||||||||||||||||||||||||||||||||||||||||||||||||||||||||||||||||||||||||||||||||||||||||||||||||||||||||||||||||||||||||||||||||||||||||||||||||||||||||||||||||||||||||||||||||||||||||||||||||||||||||||||||||||||||||||||||||||||||||||||||||||||||||||||||||||||||||||||||||||||||||||||||||||||||||||||||||||||||||||||||||||||||||||||||||||||||||||||||||||||||||||||||||||||||||||||||||||||||||||||||||||||||||||||||||||||||||||||||||||||||||||||||||||||||||||||||||||||||||||||||||||||||||||||||||||||||||||||||||||||||||||||||||||||||||||||||||||||||||||||||||||||||||||||||||||||||||||||||||||||||||
Email Alert Sign Up ConfirmationInvestor overview Press releases Media CenterPartnerships. Strategic collaborators Company culture People behind the science Join our team Innovation IncubatorNew venture labs
Search terms
Philips delivers strong order intake growth in the second quarter, margin improvement and sales growth; reiterates full-year outlookJul 29, 2024 | 4 minute read
Roy Jakobs, CEO of Royal Philips:“I am encouraged by our return to order intake growth this quarter, primarily driven by North America. Within a challenging macro environment we achieved strong margin improvement, supported by our productivity program, solid operational cashflow due to improved working capital management and comparable sales growth in line with our plan. Performance improvement was driven by progress on our execution priorities and industry-leading innovations. These included FDA-cleared AI tools within our next-generation cardiovascular ultrasound platform to increase automation and productivity. We continue to focus on enhancing execution, improving end-to-end supply chain resilience and increasing agility and productivity through simplifying our operating model. Patient safety and quality remains our number one priority.”  By clicking on the link, you will be leaving the official Royal Philips ("Philips") website. Any links to third-party websites that may appear on this site are provided only for your convenience and in no way represent any affiliation or endorsement of the information provided on those linked websites. Philips makes no representations or warranties of any kind with regard to any third-party websites or the information contained therein. You are about to visit a Philips global content page  Press release | April 29, 2024 Philips delivers first-quarter results in line with 2024 performance improvement plan; Resolves the Respironics personal injury and medical monitoring litigation in the US for USD 1.1 billion  Press release | January 29, 2024 Philips delivers strong full-year results; agrees with FDA on terms of consent decree focused on Philips Respironics in the US  Press release | October 23, 2023 Philips' Third-Quarter Results 2023  Press release | July 24, 2023 Philips' Second-Quarter Results 2023  Press release | April 24, 2023 Philips' First-Quarter Results 2023  Press release | January 30, 2023 Philips' Fourth-Quarter and Annual Results 2022
Select country
Our site can best be viewed with the latest version of Microsoft Edge, Google Chrome or Firefox. Press ReleaseAmd reports second quarter 2024 financial results, related documents. SANTA CLARA, Calif., July 30, 2024 (GLOBE NEWSWIRE) -- AMD (NASDAQ:AMD) today announced revenue for the second quarter of 2024 of $5.8 billion, gross margin of 49%, operating income of $269 million, net income of $265 million and diluted earnings per share of $0.16. On a non-GAAP ( *) basis, gross margin was 53%, operating income was $1.3 billion, net income was $1.1 billion and diluted earnings per share was $0.69. “We delivered strong revenue and earnings growth in the second quarter driven by record Data Center segment revenue,” said AMD Chair and CEO Dr. Lisa Su. “Our AI business continued accelerating and we are well positioned to deliver strong revenue growth in the second half of the year led by demand for Instinct, EPYC and Ryzen processors. The rapid advances in generative AI are driving demand for more compute in every market, creating significant growth opportunities as we deliver leadership AI solutions across our business.” “AMD executed well in the second quarter, with revenue above the midpoint of our guidance driven by strong growth in the Data Center and Client segments,” said AMD EVP, CFO and Treasurer Jean Hu. “In addition, we expanded gross margin and delivered solid earnings growth, while increasing our strategic AI investments to build the foundation for future growth.” GAAP Quarterly Financial Results
Non-GAAP(*) Quarterly Financial Results
Segment Summary
Recent PR Highlights
Current Outlook AMD’s outlook statements are based on current expectations. The following statements are forward-looking and actual results could differ materially depending on market conditions and the factors set forth under “Cautionary Statement” below. For the third quarter of 2024, AMD expects revenue to be approximately $6.7 billion, plus or minus $300 million. At the mid-point of the revenue range, this represents year-over-year growth of approximately 16% and sequential growth of approximately 15%. Non-GAAP gross margin is expected to be approximately 53.5%. AMD Teleconference AMD will hold a conference call for the financial community at 2:00 p.m. PT (5:00 p.m. ET) today to discuss its second quarter 2024 financial results. AMD will provide a real-time audio broadcast of the teleconference on the Investor Relations page of its website at www.amd.com .
About AMD For more than 50 years AMD has driven innovation in high-performance computing, graphics and visualization technologies. AMD employees are focused on building leadership high-performance and adaptive products that push the boundaries of what is possible. Billions of people, leading Fortune 500 businesses and cutting-edge scientific research institutions around the world rely on AMD technology daily to improve how they live, work and play. For more information about how AMD is enabling today and inspiring tomorrow, visit the AMD (NASDAQ: AMD) website , blog , LinkedIn and X pages. Cautionary Statement This press release contains forward-looking statements concerning Advanced Micro Devices, Inc. (AMD) such as AMD’s expectations about revenue growth in the second half of 2024; AMD’s expectations about generative AI opportunities; AMD’s expectations about future growth; the features, functionality, performance, availability, timing and expected benefits of future AMD products; and AMD’s expected third quarter 2024 financial outlook, including revenue and non-GAAP gross margin, which are made pursuant to the Safe Harbor provisions of the Private Securities Litigation Reform Act of 1995. Forward-looking statements are commonly identified by words such as "would," "may," "expects," "believes," "plans," "intends," "projects" and other terms with similar meaning. Investors are cautioned that the forward-looking statements in this press release are based on current beliefs, assumptions and expectations, speak only as of the date of this press release and involve risks and uncertainties that could cause actual results to differ materially from current expectations. Such statements are subject to certain known and unknown risks and uncertainties, many of which are difficult to predict and generally beyond AMD's control, that could cause actual results and other future events to differ materially from those expressed in, or implied or projected by, the forward-looking information and statements. Material factors that could cause actual results to differ materially from current expectations include, without limitation, the following: Intel Corporation’s dominance of the microprocessor market and its aggressive business practices; Nvidia’s dominance in the graphics processing unit market and its aggressive business practices; the cyclical nature of the semiconductor industry; market conditions of the industries in which AMD products are sold; loss of a significant customer; competitive markets in which AMD’s products are sold; economic and market uncertainty; quarterly and seasonal sales patterns; AMD's ability to adequately protect its technology or other intellectual property; unfavorable currency exchange rate fluctuations; ability of third party manufacturers to manufacture AMD's products on a timely basis in sufficient quantities and using competitive technologies; availability of essential equipment, materials, substrates or manufacturing processes; ability to achieve expected manufacturing yields for AMD’s products; AMD's ability to introduce products on a timely basis with expected features and performance levels; AMD's ability to generate revenue from its semi-custom SoC products; potential security vulnerabilities; potential security incidents including IT outages, data loss, data breaches and cyberattacks; uncertainties involving the ordering and shipment of AMD’s products; AMD’s reliance on third-party intellectual property to design and introduce new products; AMD's reliance on third-party companies for design, manufacture and supply of motherboards, software, memory and other computer platform components; AMD's reliance on Microsoft and other software vendors' support to design and develop software to run on AMD’s products; AMD’s reliance on third-party distributors and add-in-board partners; impact of modification or interruption of AMD’s internal business processes and information systems; compatibility of AMD’s products with some or all industry-standard software and hardware; costs related to defective products; efficiency of AMD's supply chain; AMD's ability to rely on third party supply-chain logistics functions; AMD’s ability to effectively control sales of its products on the gray market; long-term impact of climate change on AMD’s business; impact of government actions and regulations such as export regulations, tariffs and trade protection measures; AMD’s ability to realize its deferred tax assets; potential tax liabilities; current and future claims and litigation; impact of environmental laws, conflict minerals related provisions and other laws or regulations; evolving expectations from governments, investors, customers and other stakeholders regarding corporate responsibility matters; issues related to the responsible use of AI; restrictions imposed by agreements governing AMD’s notes, the guarantees of Xilinx’s notes and the revolving credit agreement; impact of acquisitions, joint ventures and/or investments on AMD’s business and AMD’s ability to integrate acquired businesses; impact of any impairment of the combined company’s assets; political, legal and economic risks and natural disasters; future impairments of technology license purchases; AMD’s ability to attract and retain qualified personnel; and AMD’s stock price volatility. Investors are urged to review in detail the risks and uncertainties in AMD’s Securities and Exchange Commission filings, including but not limited to AMD’s most recent reports on Forms 10-K and 10-Q.
AMD, the AMD Arrow logo, EPYC, Radeon, Ryzen, Instinct, Versal, Alveo, Kria, FidelityFX, 3D V-Cache, Ultrascale+, Zynq, Threadripper and combinations thereof, are trademarks of Advanced Micro Devices, Inc.
The Company presents “Adjusted EBITDA” as a supplemental measure of its performance. Adjusted EBITDA for the Company is determined by adjusting GAAP net income (loss) for interest expense, other income (expense), net, income tax provision (benefit), equity income in investee, stock-based compensation, depreciation and amortization expense (including amortization of acquisition-related intangibles), inventory loss at contract manufacturer, and acquisition-related and other costs. The Company calculates and presents Adjusted EBITDA because management believes it is of importance to investors and lenders in relation to its overall capital structure and its ability to borrow additional funds. In addition, the Company presents Adjusted EBITDA because it believes this measure assists investors in comparing its performance across reporting periods on a consistent basis by excluding items that the Company does not believe are indicative of its core operating performance. The Company’s calculation of Adjusted EBITDA may or may not be consistent with the calculation of this measure by other companies in the same industry. Investors should not view Adjusted EBITDA as an alternative to the GAAP operating measure of income or GAAP liquidity measures of cash flows from operating, investing and financing activities. In addition, Adjusted EBITDA does not take into account changes in certain assets and liabilities that can affect cash flows.
The Company also presents free cash flow as a supplemental Non-GAAP measure of its performance. Free cash flow is determined by adjusting GAAP net cash provided by operating activities for capital expenditures, and free cash flow margin % is free cash flow expressed as a percentage of the Company's net revenue. The Company calculates and communicates free cash flow in the financial earnings press release because management believes it is of importance to investors to understand the nature of these cash flows. The Company’s calculation of free cash flow may or may not be consistent with the calculation of this measure by other companies in the same industry. Investors should not view free cash flow as an alternative to GAAP liquidity measures of cash flows from operating activities. Media Contact: Drew Prairie AMD Communications 512-602-4425 [email protected] Investor Contact: Mitch Haws AMD Investor Relations 408-749-3124 [email protected] Released July 30, 2024 Press Releases 3M Delivers Strong Second-Quarter Results; Company Updates Full-Year 2024 Earnings GuidanceRelated documents.
ST. PAUL, Minn. , July 26, 2024 /PRNewswire/ -- 3M (NYSE: MMM) today reported second-quarter results. "We delivered another strong quarter with adjusted earnings growth up double-digits and robust cash generation. I want to thank 3M employees for their exceptional execution, which we expect to continue in the second half of the year," said William Brown, 3M Chief Executive Officer. "As I look ahead, I am focused on three priorities: driving sustained organic revenue growth, increasing operational performance, and effectively deploying capital. I have long admired 3M's track record of innovation and am excited to be leading this great company and by the opportunities ahead." Second -Quarter Highlights:
This document includes reference to certain non-GAAP measures. See the "Supplemental Financial Information Non-GAAP Measures" section for applicable information. Updated Full-Year 2024 Earnings Outlook 3M updated its full-year adjusted earnings expectations given the company's strong operational execution in the first half of the year. The 2024 earnings outlook below reflects the continuing operations of 3M.
Conference Call 3M will conduct an investor teleconference at 9 a.m. EDT (8 a.m. CDT) today. Investors can access this conference via the following:
Consolidated Financial Statements and Supplemental Financial Information Non-GAAP Measures View the Financial Statement Information on 3M's website: https://investors.3m.com/financials/quarterly-earnings Forward-Looking Statements This news release contains forward-looking statements. You can identify these statements by the use of words such as "plan," "expect," "aim," "believe," "project," "target," "anticipate," "intend," "estimate," "will," "should," "could," "would," "forecast" and other words and terms of similar meaning. Forward-looking statements are based on certain assumptions and expectations of future events and trends that are subject to risks and uncertainties. Actual future results and trends may differ materially from historical results or those reflected in any such forward-looking statements depending on a variety of factors. Among the factors that could cause actual results to differ materially are the following: (1) worldwide economic, political, regulatory, international trade, geopolitical, capital markets and other external conditions and other factors beyond the Company's control, including inflation, recession, military conflicts, and natural and other disasters or climate change affecting the operations of the Company or its customers and suppliers; (2) foreign currency exchange rates and fluctuations in those rates; (3) liabilities and the outcome of contingencies related to certain fluorochemicals; known as "PFAS," including liabilities related to claims, lawsuits, and government regulatory proceedings concerning various PFAS-related products and chemistries, as well as risks related to the Company's plans to exit PFAS manufacturing and discontinue use of PFAS across its product portfolio; (4) risks related to the class-action settlement to resolve claims by public water suppliers in the United States regarding PFAS; (5) legal proceedings, including significant developments that could occur in the legal and regulatory proceedings described in the Company's reports on Form 10-K, 10-Q and 8-K (the "Reports"); (6) competitive conditions and customer preferences; (7) the timing and market acceptance of new product and service offerings; (8) the availability and cost of purchased components, compounds, raw materials and energy due to shortages, increased demand and wages, supply chain interruptions, or natural or other disasters; (9) unanticipated problems or delays with the phased implementation of a global enterprise resource planning system, or security breaches and other disruptions to the Company's information technology infrastructure; (10) the impact of acquisitions, strategic alliances, divestitures, and other strategic events resulting from portfolio management actions and other evolving business strategies; (11) operational execution, including the extent to which the Company can realize the benefits of planned productivity improvements, as well as the impact of organizational restructuring activities; (12) financial market risks that may affect the Company's funding obligations under defined benefit pension and postretirement plans; (13) the Company's credit ratings and its cost of capital; (14) tax-related external conditions, including changes in tax rates, laws or regulations; (15) matters relating to the spin-off of the Company's Health Care business, including the risk that the expected benefits will not be realized; the risk that the costs or dis-synergies will exceed the anticipated amounts; potential business disruption; the diversion of management time; the impact of the transaction on the Company's ability to retain talent; potential impacts on the Company's relationships with its customers, suppliers, employees, regulators and other counterparties; the ability to realize the desired tax treatment; the risk that any consents or approvals required will not be obtained; risks under the agreements and obligations entered into in connection with the spin-off, and (16) matters relating to Combat Arms Earplugs ("CAE"), including those related to, the August 2023 settlement that is intended to resolve, to the fullest extent possible, all litigation and alleged claims involving the CAE sold or manufactured by the Company's subsidiary Aearo Technologies and certain of its affiliates and/or the Company. A further description of these factors is located in the Reports under "Cautionary Note Concerning Factors That May Affect Future Results" and "Risk Factors" in Part I, Items 1 and 1A (Annual Report) and in Part I, Item 2 and Part II, Item 1A (Quarterly Reports). Changes in such assumptions or factors could produce significantly different results. The Company assumes no obligation to update any forward-looking statements discussed herein as a result of new information or future events or developments. 3M (NYSE: MMM) believes science helps create a brighter world for everyone. By unlocking the power of people, ideas and science to reimagine what's possible, our global team uniquely addresses the opportunities and challenges of our customers, communities, and planet. Learn how we're working to improve lives and make what's next at 3M.com/news. Please note that the company announces material financial, business and operational information using the 3M investor relations website, SEC filings, press releases, public conference calls and webcasts. The company also uses the 3M News Center and social media to communicate with our customers and the public about the company, products and services and other matters. It is possible that the information 3M posts on the News Center and social media could be deemed to be material information. Therefore, the company encourages investors, the media and others interested in 3M to review the information posted on 3M's news center and the social media channels such as @3M or @3MNews. Contacts 3M Investor Contacts: Bruce Jermeland, 651-733-1807 or Diane Farrow, 612-202-2449 or Eric Herron, 651-233-0043 Media Contact: Sean Lynch, [email protected] View original content to download multimedia: https://www.prnewswire.com/news-releases/3m-delivers-strong-second-quarter-results-company-updates-full-year-2024-earnings-guidance-302207264.html SOURCE 3M Company Released July 26, 2024
 2024 Half-Year ResultsContinued strong growth and market outperformance, further operating margin improvement.
Commenting on these figures, Nicolas Hieronimus, CEO of L'Oréal, said: “In the first half, we delivered strong growth of +7.3%, well-balanced between value and volume and strengthened our global leadership in a beauty market that remains dynamic. Our continued strong momentum in emerging markets, Europe and North America allowed us to more than offset the depressed beauty market in mainland China and the unfavourable comparative in Travel Retail. In this context, I am particularly pleased to see the acceleration of L’Oréal Luxe, the dynamism of Consumer Products and the continued share gains of Dermatological Beauty and Professional Products. The combination of our powerful R&I and unique marketing creativity allowed us to offer consumers groundbreaking innovations. The consistent increase of our A&P spend to support these innovations and our 37 international brands allowed us to, once again, outpace the global beauty market. In an environment that continues to be marked by economic and geopolitical tensions, we remain optimistic about the outlook for the beauty market and confident that our innovation power and the robustness of our multi-polar model will allow us to keep outperforming it and to achieve another year of growth in sales and profit.” The Board of Directors has decided, under the authorisation approved by the Annual General Meeting of 23 April 2024, to set up a share buyback programme during the second half of 2024 amounting to a maximum of 500 million euros and with a maximum number of shares to be acquired of 2 million. The shares thus repurchased are intended to be cancelled 2 . 2024 HALF-YEAR SALESIn the first six months, sales amounted to 22.12 billion euros , up +7.5% reported. Like-for-like , i.e., based on a comparable structure and identical exchange rates, sales grew by +7.3%. The net impact of changes in the scope of consolidation was +2.5%. Growth at constant exchange rates came out at +9.8%. Currency fluctuations had a negative impact of -2.3% at the end of June 2024. If the exchange rates as of 30 June 2024, i.e., €1 = $1.0700, are extrapolated until 31 December, the impact of currency fluctuations on sales would be around -1.1% for the whole of 2024. Sales by Division and Region
Summary by DivisionProfessional products. The Professional Products Division delivered robust growth of +5.7% like-for-like and +4.9% reported. Professional Products grew across all regions: in developed markets, North Asia including China, as well as emerging markets, notably GCC 4 and Latin America. It outpaced the global professional market. The Division continues to expand through its omnichannel strategy with strong acceleration in e-commerce and selective distribution. In the dynamic haircare market, growth was fuelled by new product launches: Kérastase Première is off to an excellent start; L’Oréal ProfessionnelAbsolut Repair Molecular continued its successful roll-out; Redken was boosted by the ongoing success of Acidic Bonding Concentrate and the promising debut of Acidic Color Gloss . In hair colour, Shades EQ from Redken , iNOA, as well as Dia Color by L’Oréal Professionnel maintained their momentum. In the second half of the year, the Division will further capitalise on the market for hair devices with the debut of AirLight Pro , a revolutionary hair dryer by L’Oréal Professionnel – reinforcing the Division's commitment to bringing cutting-edge technology and innovation to the professional haircare industry. CONSUMER PRODUCTSThe Consumer Products Division achieved strong growth of +8.9% like-for-like and +8.3% reported. The first half performance reinforced the Division’s democratisation and premiumisation strategy driven by strong value (combining price and mix), while maintaining positive volumes. Growth was driven by particularly strong performances in Europe and emerging markets, notably Brazil, Mexico, and India. All major brands advanced strongly. Most remarkable was the excellent performance of L’Oréal Paris , the world’s number one beauty brand, which continued to grow in double digits. All categories remained dynamic, fuelled by powerful innovations and activations. Haircare was a particular highlight, driven by continued premiumisation: L’Oréal Paris led the way with the remarkable success of Elvive Glycolic Gloss . Makeup delivered double-digit growth thanks to new launches like L’Oréal Paris Panorama mascara, NYX Professional Makeup Duck Plump lip gloss, and Maybelline New York ’s Sunkisser blush. Skincare remained very dynamic, with Garnier democratising the daily use of UV fluids, L’Oréal Paris launching Bright Reveal, a scientific breakthrough in the fight against dark spots, and Mixa pursuing its successful expansion in Europe. L’Oréal Luxe posted growth of +2.3% like-for-like, accelerating in 2Q24, and +4.0% reported. Growth was robust in Europe, and in double digits in North America as well as in emerging markets; on an aggregate basis, L’Oréal Luxe outperformed the luxury beauty market across these three regions. In mainland China, the Division continued to gain share in a negative market; Travel Retail in North Asia, meanwhile, saw first signs of improvement. Japan remained very dynamic. Fragrances were, once again, the most dynamic category, and L’Oréal Luxe outperformed the market across all regions, thanks to Couture brands like Yves Saint Laurent , Valentino , Maison Margiela and Prada , and lifestyle brands such as Azzaro . The rebound of makeup continued, fuelled by powerful innovations from Yves Saint Laurent , Armani , and Urban Decay . Aesop pursued its expansion plan. The other recently acquired brands remained very dynamic. DERMATOLOGICAL BEAUTYDermatological Beauty reported excellent growth of +16.4% like-for-like and +15.5% reported. The Division maintained its strong momentum, growing significantly faster than the dermo-cosmetics market, which remains dynamic despite the slowdown in the US. This outperformance once again vindicated its successful growth strategy, boosted by its medical leadership and unparalleled R&I foundation. Developed and emerging markets as well as North Asia grew in double digits as Dermatological Beauty pursued its global expansion. In mainland China, the Division continued to make significant inroads, driven by SkinCeuticals and CeraVe . With strong double-digit growth across all regions, La Roche-Posay remained thenumber one growth contributor to the Division. This was fuelled by the success of breakthrough innovation MelaB3 , addressing localised pigmentation issues based on the multi-patented Melasyl™ molecule. CeraVe continued to grow strongly, significantly outperforming the global market. Vichy maintained its double-digit pace, supported by the success of its Dercos haircare franchise. Skinbetter Science sustained its strong momentum in the US and is off to a promising start in Canada. Summary by RegionEurope posted impressive growth of +11.1% like-for-like and +12.2% reported. L’Oréal continued to outperform a market that remained dynamic. Growth was broad-based across countries with particularly strong contributions from the Germany-Austria-Switzerland, Spain-Portugal, and UK-Ireland clusters and impressive momentum across the midsized countries. Each of the four categories advanced in double digits with makeup and skincare particularly dynamic. Consumer Products posted strong growth with stand-out performances by L'Oreal Paris - notably in haircare - as well as Maybelline New York and NYX Professional Makeup , fuelled by new launches. L'Oréal Luxe performed broadly in line with the market; growth was particularly dynamic in fragrances as well as makeup. Dermatological Beauty advanced strongly across all countries thanks to the complementarity of the Division’s brand portfolio. Professional Products benefited from a number of successful launches with all three key brands growing. NORTH AMERICANorth America reported robust growth of +7.8% like-for-like and +8.7% reported. Adjusted for the impact of phasing (related to the implementation of new IT systems), the region maintained a balanced rhythm throughout the first half. All Divisions grew, led by Dermatological Beauty and L’Oréal Luxe. Growth in Consumer Products was driven by haircare as L’Oréal Paris continued to outpace the market; the brand recently introduced Colorsonic , its first at home hair colouration device. In makeup, NYX Professional Makeup advanced strongly thanks to the launch of Fat Oil and Duck Plump ; Maybelline New York’s recent innovation is off to a promising start. Fuelled by the success of its unique fragrance portfolio, L’Oréal Luxe outperformed the luxury beauty market. Valentino’s Born in Roma , now in the top-three for both men and women, and Yves Saint Laurent’s MYSLF continued to grow strongly; Ralph Lauren was boosted by the launch of Polo 67 . Following in the successful footsteps of Lancôme , Kiehl’s was launched on Amazon in the second quarter. Dermatological Beauty outpaced the dermo-cosmetics market with particularly strong contributions from La Roche-Posay , boosted by the Mela B3 launch, and Skinbetter Science . CeraVe stayed the number one skincare brand. Professional Products grew ahead of its market, driven by successful launches like Kérastase’s Première and Redken’s Acidic Color Gloss , as well as the continued pursuit of its omni-channel strategy. Sales in North Asia contracted -1.7% like-for-like and -3.1% reported. Operating conditions in the Chinese ecosystem remained challenging. In mainland China, the beauty market was negative in the second quarter on a tough comparison base, exacerbated by lasting low consumer confidence. In the first half, L’Oréal delivered low single-digit growth and gained market share thanks to Dermatological Beauty, Professional Products as well as L’Oréal Luxe which broke new records. While Travel Retail still weighed on growth in the first half, its momentum has been improving sequentially. Japan maintained double-digit growth, benefiting from the return of tourism. By Division, growth was led by Dermatological Beauty with all brands contributing, as well as by Professional Products thanks to the ongoing success of Kérastase . Consumer Products recorded low single-digit growth, driven by L'Oréal Paris and Maybelline New York . L'Oréal Luxe was hampered by the depressed market in mainland China and Travel Retail but progressed well in other parts of the region; the Couture brands were the best performers. SAPMENA–SSA 3Sales in SAPMENA-SSA saw an outstanding growth of +15.2% like-for-like and +14.3% reported. In SAPMENA, growth was broad-based by category and Division. Volume and value both contributed, the latter fueled by a balanced combination of mix and price. By country, key growth contributors were the Australia-New Zealand cluster, Thailand, Saudi Arabia, and India. By Division, the most remarkable performances were in Dermatological Beauty, as CeraVe had another outstanding performance, as well as Consumer Products, driven by L’Oréal Paris and Garnier , and Luxe, where Yves Saint Laurent and Prada were the main growth contributors. Fragrances remained the fastest-growing category, boosted by new launches. Skincare advanced strongly thanks to Dermatological Beauty and Consumer Products. Haircare was driven by premiumisation in both the consumer and professional channels. Online remained particularly dynamic across the region, notably in South-East Asia and India. Sub-Saharan Africa (SSA) saw remarkable growth, broad-based across countries. All categories contributed, notably skincare. By Division, the main growth contributors were Consumer Products and Dermatological Beauty, driven by Garnier and La Roche-Posay , respectively. LATIN AMERICALatin America delivered outstanding growth of +14.2% like-for-like and +15.8% reported. Growth was fuelled by a balanced contribution from both value and volume. The performance was broad-based across the region, with particularly remarkable momentum in Mexico, the Group’s second largest growth contributor, and Brazil. Argentina was impacted by the economic crisis and the subsequent contraction in consumption. All Divisions grew. Consumer Products maintained exceptional momentum with L’Oréal Paris particularly dynamic; Elsève has become the number one haircare brand in Brazil in value. Growth in Dermatological Beauty was driven by La Roche-Posay and CeraVe . By category, haircare had outstanding growth across all three Divisions. The other categories also progressed strongly with makeup and fragrances particularly dynamic. Sales progressed faster online than offline, driven primarily by pure players. IMPORTANT EVENTS SINCE THE LAST PUBLICATIONIn June, CEO Nicolas Hieronimus gave a keynote speech at The Consumer Goods Forum in Chicago, demonstrating how L’Oréal is “Revolutionising Beauty with Technology.” Consumer Products Division President Alexis Perakis-Valat joined a panel to deep dive into how L’Oréal creates a circular economy for plastics. RESEARCH, BEAUTY TECH AND DIGITAL L’Oréal Advanced Research and the University of Oregon pioneered the first successful development of a bioprinted skin model mimicking natural human skin . Resulting from the L’Oréal Skin Technology Platform, this model enables the rapid and precise construction of skin-like structures. This reinforced the Group’s commitment to innovation and to Beauty with no animal testing. At Viva Technology in Paris , L’Oréal unveiled a number of Beauty Tech innovations: Skin Technology, facial treatment Renergie Nano-Surfacer|400 Booster ( Lancôme ), skin diagnosis tool Derma-Reader (Kiehl’s) , hair health analyser My Hair [iD] - Hair Reader (L’Oréal Professionnel) , personal beauty assistant Beauty Genius (L’Oréal Paris) and CREAITECH , the Gen AI Beauty Content Lab. In June, the Cannes Lions International Festival of Creativity 2024 awarded CeraVe the GRAND PRIX for Social & Influencer Marketing , alongside nine other Cannes Lions Awards, making CeraVe one of the top-10 most awarded brands at the event. ENVIRONMENTAL, SOCIAL AND GOVERNANCE PERFORMANCE In June, Moody’s once again awarded L’Oréal 74 points out of 100 in its ESG Assessment, well above the sector average. The score underlines L'Oréal’s sustainable transformation towards a more responsible and inclusive business model through the implementation of an ambitious sustainability strategy. L’Oréal scored a total of 69 RoSPA (Royal Society for the Prevention of Accidents) awards across 70 sites, covering close to 46,000 employees, continuing to demonstrate its unwavering commitment to health and safety. In alignment with its L’Oréal for the Future sustainability ambitions, the Group announced the adoption of EcoDesignCloud by Eviden , which measures the environmental footprint of point-of-sale as well as promotional materials. In May, Fondation L’Oréal and UNESCO announced the winners of the 26 th L’Oréal-UNESCO For Women in Science International Awards , honouring them for their pioneering research in life and environmental sciences. Since the creation of the programme, 7 of the 132 laureates have received Nobel Prices in science. In June, L’Oréal announced the launch of its fourth Employee Share Ownership Plan (ESOP), which was rolled out in over 60 countries, allowing employees to be even more closely linked to the group development. The ambition is to renew the ESOP each year, subject to the usual authorisations. 2024 HALF-YEAR RESULTSThe limited review procedures of the half-year consolidated accounts have been completed. The limited review report is being prepared by the Statutory Auditors. Operating profitability at 20.8% of salesConsolidated profit and loss account: from sales to operating profit.
Gross profit , at 16,552.1 million euros, came out at 74.8% of sales compared with 74.3% in the first half of 2023, an increase of 50 basis points. Research & Innovation expenses , at 667.3 million euros, came out at 3.0% of sales. Advertising and promotion expenses , at 7,109.1 million euros, came out at 32.1% of sales, a decrease of 40 basis points. Selling, general and administrative expenses , at 18.9% of sales, increased by 80 basis points. Overall, operating profit increased by +8.0% to 4,599.1 million euros and amounted to 20.8% of sales, an increase of 10 basis points compared with the first half of 2023. Operating profit by Division
The L’Oréal group is managed on an annual basis. This means that half-year operating profits cannot be extrapolated for the whole year. The profitability of the Professional Products Division came out at 22.1% of sales, up 90 basis points. The profitability of the Consumer Products Division came out at 22.0% of sales, up 100 basis points. The profitability of the Luxe Division came out at 21.9% compared to 23.2% in 2023. The profitability of the Dermatological Beauty Division came out at 28.9%, up 50 basis points. Net profit excluding non-recurring itemsConsolidated profit and loss account: from operating profit to net profit excluding non-recurring items.
Overall financial expenses came out at 131.0 million euros. Sanofi dividends amounted to 444.5 million euros. Income tax excluding non-recurring items came out at 1,163.9 million euros, i.e. a tax rate of 23.7%. Net profit excluding non-recurring items after non-controlling interests came out at 3,744.6 million euros. Earnings per share , at 6.98 euros, increased by +3.7% compared with the first half of 2023. Consolidated profit and loss account: from net profit excluding non-recurring items to net profit.
Non-recurring items amounted to 89.0 million euros net of tax. Operating cash flow and balance sheetGross cash flow amounted to 4,514 million euros, an increase of +3.1%. The change in working capital amounted to -1,745 million euros. Investments, at 781 million euros, represented 3.5% of sales. Operating cash flow 8 amounted to 1,987 million euros, compared to 2,097 million euros at the end of June 2023. As of 30 June 2024, after taking into account finance lease liabilities for 1,895 million euros, net debt amounted to 6,459 million euros. “This news release does not constitute an offer to sell, or a solicitation of an offer to buy L’Oréal shares. If you wish to obtain more comprehensive information about L’Oréal, please refer to the public documents registered in France with the Autorité des Marchés Financiers, also available in English on our website www.loreal-finance.com . This news release may contain some forward-looking statements. While the Company believes that these statements are based on reasonable assumptions as of the date of publication of this press release, they are by nature subject to risks and uncertainties which may lead to a discrepancy between the actual figures and those indicated or suggested in these statements.” About L’Oréal For 115 years, L’Oréal, the world’s leading beauty player, has devoted itself to one thing only: fulfilling the beauty aspirations of consumers around the world. Our purpose, to create the beauty that moves the world, defines our approach to beauty as essential, inclusive, ethical, generous and committed to social and environmental sustainability. With our broad portfolio of 37 international brands and ambitious sustainability commitments in our L’Oréal for the Future programme, we offer each and every person around the world the best in terms of quality, efficacy, safety, sincerity and responsibility, while celebrating beauty in its infinite plurality. With more than 90,000 committed employees, a balanced geographical footprint and sales across all distribution networks (ecommerce, mass market, department stores, pharmacies, perfumeries, hair salons, branded and travel retail), in 2023 the Group generated sales amounting to 41.18 billion euros. With 20 research centers across 11 countries around the world and a dedicated Research and Innovation team of over 4,000 scientists and 6,400 Digital talents, L’Oréal is focused on inventing the future of beauty and becoming a Beauty Tech powerhouse. More information on https://www.loreal.com/en/mediaroom L’ORÉAL CONTACTS Switchboard +33 (0) 1 47 56 70 00 Individual shareholders and market authorities Pascale Guerin +33 (0)1 49 64 18 89 [email protected] Investor relations Eva Quiroga +33 (0)7 88 14 22 65 [email protected] Journalists Brune Diricq +33 (0)6 63 85 29 87 [email protected] Christine Burke +33 (0)6 75 54 38 15 [email protected] For more information, please contact your bank, broker or financial institution (I.S.I.N. code: FR0000120321), and consult your usual newspapers, the website for shareholders and investors, www.loreal-finance.com or the L’Oréal Finance app; alternatively, call +33 (0)1 40 14 80 50. This press release has been secured and authenticated with the blockchain technology. You can verify its authenticity on the website www.wiztrust.com Appendix 1: L’Oréal group sales 2023/2024 (€ million)
Appendices 2 to 6 are available in the full PDF version of the news release which can be downloaded below. 1 Like-for-like: based on a comparable structure and identical exchange rates. 2 The L'Oréal Universal Registration Document filed with the AMF (Autorités des Marchés Financiers) on 19 March 2024 includes, on page 400, the other pieces of information that must appear in the share buyback programme description pursuant to Article 241-2 of the General Regulation of the AMF. 3 SAPMENA–SSA: South Asia Pacific, Middle East, North Africa, Sub-Saharan Africa. 4 GCC: Gulf Cooperation Council. 5 Non-allocated expenses = Central Group expenses, fundamental research expenses, free grant of shares expenses and miscellaneous items. 6 Net profit excluding non-recurring items, after non-controlling interests, excludes mostly capital gains and losses on disposals of long-term assets, impairment of assets, restructuring costs, tax effects and non-controlling interests. 7 Diluted net profit per share, excluding non-recurring items, after non-controlling interests. 8 Operating cash flow = Gross cash flow + changes in working capital - capital expenditure.
Share price
Explore the Annual ReportThrough our 2023 Annual Report take a deep dive into beauty – our vocation and sole focus for the past 115 years. Discover the excellence of the L'Oréal model through the most significant initiatives of the year.  Chairman’s message CEO Interview Financial Performance Environmental and social performance | |||||||||||||||||||||||||||||||||||||||||||||||||||||||||||||||||||||||||||||||||||||||||||||||||||||||||||||||||||||||||||||||||||||||||||||||||||||||||||||||||||||||||||||||||||||||||||||||||||||||||||||||||||||||||||||||||||||||||||||||||||||||||||||||||||||||||||||||||||||||||||||||||||||||||||||||||||||||||||||||||||||||||||||||||||||||||||||||||||||||||||||||||||||||||||||||||||||||||||||||||||||||||||||||||||||||||||||||||||||||||||||||||||||||||||||||||||||||||||||||||||||||||||||||||||||||||||||||||||||||||||||||||||||||||||||||||||||||||||||||||||||||||||||||||||||||||||||||||||||||||||||||||||||||||||||||||||||||||||||||||||||||||||||||||||||||||||||||||||||||||||||||||||||||||||||||||||||||||||||||||||||||||||||||||||||||||||||||||||||||||||||||||||||||||||||||||||||||||||||||||||||||||||||||||||||||||||||||||||||||||||||||||||||||||||||||||||||||||||||||||||||||||||||||||||||||||||||||||||||||||||||||||||||||||||||||||||||||||||||||||||||||||||||||||||||||||||||||||||||||
COMMENTS
A successful sales report presentation features the following slides on its deck: Title Slide; Agenda Slide; Sales Performance Slide: Sales figures and trends. Target vs Actual Slide: Comparison of targets and actual sales. Sales by Region/Product Slide: Breakdown of sales data. Sales Pipeline Slide: Status of sales leads and opportunities.
On one hand, a sales presentation is designed to persuade potential customers about the value of your product or service. It typically includes detailed information about your product, its features, benefits, pricing, case studies, testimonials, and more. On the other hand, a sales deck is essentially a condensed version of a sales presentation.
Turn bland sales reports into captivating presentations with free Sales Report PowerPoint Templates and Google Slides themes. Impress bosses, wow clients, and motivate your team with creative visuals, editable charts, and easy-to-understand layouts. Grab attention, secure funding, and crush goals - all without design headaches.
What a sales presentation isn't, is a sales report where the presenter gives results on sales activity. Think of a sales presentation as before the sale takes place and a sales report as to what happens after. Below is a pitch deck presentation template that can easily work as a sales presentation. Simply take out some of the slides and fill ...
CUSTOMIZE THIS SALES REPORT Simple sales presentation examples. A simple sales presentation provides a clear and unobstructed pathway to your main message, ensuring that the audience's focus remains undivided. Perfect for highlighting key information, it ensures that your products or services are front and center, unobscured by excessive ...
A sales presentation (although it's still a sales pitch) is a point-in-time event that usually happens when your sales team is trying to close a more lucrative deal. It's not a simple phone call, as it often involves a meeting and a demo. Because you're likely presenting to a group of senior decision-makers and executives, sales ...
Dashi - Sales Report PowerPoint Presentation. Dashi is a PowerPoint template made just for professional marketers. You can use it to design visual and beautiful slideshows for presenting your sales dashboards and reports. The template has 10 slides featuring more than 30 character positions, over 2000 vector icons, and 30 business concepts.
7 Types of Slides to Include In Your Sales Presentation. The "Before" picture: No more than three slides with relevant statistics and graphics. The "After" picture: How life looks with your product. Use happy faces. Company introduction: Who you are and what you do (as it applies to them).
The main types of sales reports include daily, weekly, monthly and yearly sales reports. Follow these steps to create a sales report on Visme: Login to your Visme editor, choose a sales report template, input your sales data, customize your sales report, then publish and share your reports. Visme's easy-to-use editor, features and customizable ...
6. Average Deal Size. The deal size report helps you determine the number of sales needed to achieve a specific revenue target. For example, If every won deal produces $5,000 of revenue and your sales goal is $50,000, then you know that your team needs to close ten new deals within that time frame.
4. Quarter-wise Product Sales Improvement Table Report Template. This expert-designed neat presentation template provides a structured framework to assess the effectiveness of your sales strategies with a glance at numbers. It allows you to track and compare key metrics of three products in four quarters.
Template 1: Annual Sales Report PowerPoint Presentation. Deliver a straightforward annual report presentation using this comprehensive template, loaded with user-friendly features, graphics, and visuals. Navigate fool-proof slides featuring the annual sales report dashboard and a breakdown by product categories and month.
Deliver sales presentation with confidence with this Sales Reports PowerPoint Presentation slide. This 65 designs PPT template has been designed for the use of sales managers and executives. Every quarter you have to present your sales report with senior management team. This multipurpose presentation deck ensures that you don't miss out on ...
Corporate Sales Report PowerPoint Template. Number of slides: 16. Signup Free to download. The actual sales of a company show how good its business operations are. The business environment is highly competitive and therefore, having comprehensible sales statistics is of utmost importance. By using this sales report template you can properly ...
Sales Report Presentation Template; Our list of templates for data presentations won't be complete without a sales report template. As you can see, this template is great for in-house sales reports. This pack includes a vertical bar chart slide, marketing funnel slide (pictured), and a sales associate slide.
The monthly sales report is very important in any business success.Hence, it's important for a sales report to be presented accurately and clearly.This monthly sales report presentation template from Piktochart is designed to showcase progress and updates in a clear manner. Available File Type
This sleek and modern template will enable you to present complex data in an easily digestible and visually appealing manner, ensuring that your audience remains engaged and informed. This …. Download 100% free sales report templates for PowerPoint presentations. Our free sales report PPT templates can help you preparing excellent reports to ...
A study examined the habits of almost 5,000 sales professionals whose livelihoods depend on their ability to build and deliver persuasive presentations. The findings revealed 12 common mistakes ...
Product details. At its core, the MoSCoW method is simply a prioritization framework that can be applied to any kind of situation or project, but it works best when a large number of tasks need to be ruthlessly whittled down into a prioritized and achievable to-do list. The core aim of the process is to classify tasks into four buckets; Must ...
Merck's (NYSE: MRK) Q2 2024 results demonstrate strong business momentum and further progress in our diverse pipeline. Our company announced worldwide sales of $16.1 billion, an increase of 7% from Q2 2023. "Our business is demonstrating strong momentum as we exit the first half of the year," said Rob Davis, chairman and chief executive officer. […]
Presenting Sales Reporting PPT with a set of 63 slides to show your mastery of the subject. Use this ready-made PowerPoint presentation to present before your internal teams or the audience. All presentation designs in this deck have been crafted by our team of expert PowerPoint designers using the best of PPT templates, images, data-driven ...
MoSCoW prioritization, also known as the MoSCoW method or MoSCoW analysis, is a popular prioritization technique for managing requirements. The acronym MoSCoW represents four categories of initiatives: must-have, should-have, could-have, and won't-have, or will not have right now. Some companies also use the "W" in MoSCoW to mean "wish.".
These initiatives follow the establishment of separate financial reporting for Intel Products and Intel Foundry, which provides a "clean sheet" view of the business and has uncovered significant opportunities to drive meaningful operational and cost efficiencies. ... Reducing Cost of Sales: ... down 0.4 ppt 38.7% 39.8% down 1.1 ppts R&D and MG ...
Q4 '24: Net Sales 0%; Organic Sales +2%; Diluted EPS -7%; Core EPS +2% FY '24: Net Sales +2%; Organic Sales +4%; Diluted EPS +2%; Core EPS +12% The Procter Gamble Company (NYSE:PG) reported fourth quarter and fiscal year 2024 results. "Fiscal year 2024 was another year of strong results for PG," said Jon Moeller, Chairman of the Board, President and Chief Executive Officer. "The team ...
Make sure your data is accurate, up-to-date, and relevant to your presentation topic. Your goal will be to create clear conclusions based on your data and highlight trends. 2. Know your audience. Knowing who your audience is and the one thing you want them to get from your data is vital.
Reports second quarter revenues of $241 million, GAAP net loss of $1.3 billion and GAAP EPS of $(3.33) Updates 2024 financial framework and revises expectations for product sales to $3.0 to $3.5 billion Received U.S. FDA approval for RSV vaccine, mRESVIA, and began shipping in July; received EMA positive opinion in June Announced positive Phase 3 data for combination vaccine against influenza ...
Due to rounding, amounts may not add up precisely to totals provided. All reported data is unaudited. Financial reporting is in accordance with the accounting policies as stated in the Annual Report 2023. Prior-period amounts have been reclassified to conform to the current-period presentation; this includes immaterial organizational changes.
SANTA CLARA, Calif., July 30, 2024 (GLOBE NEWSWIRE) -- AMD (NASDAQ:AMD) today announced revenue for the second quarter of 2024 of $5.8 billion, gross margin of 49%, operating income of $269 million, net income of $265 million and diluted earnings per share of $0.16. On a non-GAAP (*) basis, gross margin was 53%, operating income was $1.3 billion, net income was $1.1 billion and diluted ...
Sales of $6.3 billion, down 0.5% year-on-year, with organic sales down 0.3% year-on-year. Adjusted sales of $6.0 billion, up 1.1% year-on-year with adjusted organic sales up 1.2% year-on-year. Operating cash flow of $1.0 billion; adjusted free cash flow of $1.2 billion. 3M returned $786 million to shareholders via dividends and share repurchases.
Strategic presentations by General Management as well as webcasts of the financial results and sales, Annual General Meeting and Investor Analyst Conferences. ... Sales in North Asia contracted -1.7% like-for-like and -3.1% reported. ... Through our 2023 Annual Report take a deep dive into beauty - our vocation and sole focus for the past 115 ...