- Thesis Action Plan New
- Academic Project Planner

Literature Navigator
Thesis dialogue blueprint, writing wizard's template, research proposal compass.
- Why students love us
- Rebels Blog
- Why we are different
- All Products
- Coming Soon
Understanding the Formulation of Hypothesis in Academic Research

Creating a hypothesis is a vital part of academic research. It provides a clear direction for the study and helps researchers focus their investigations. By forming a testable prediction, researchers can design their studies more effectively and analyze their data with a clear purpose in mind. Understanding how to formulate a good hypothesis is essential for anyone involved in research.
Key Takeaways
- A hypothesis offers a clear direction for research and helps focus the study.
- Formulating a hypothesis involves investigating background research, forming a theory, and testing it.
- There are different types of hypotheses, including null, alternative, directional, and non-directional.
- A good hypothesis should be testable, clear, precise, and relevant to the research question.
- Common pitfalls in hypothesis formulation include overgeneralization, lack of clarity, and ignoring theoretical frameworks.
The Importance of Hypotheses in Academic Research
Defining hypotheses.
A hypothesis is a predictive, testable statement that forecasts the outcome and results you expect to find. It provides a summary of the direction taken to investigate a theory. Crafting a clear, testable, and grounded hypothesis is crucial for research success.
Role in Research Design
Hypotheses determine the direction and organization of your research methods . They ensure that you have carefully planned how the research will be done. This is known as the scientific method. By identifying the research question and conducting a literature review, you can formulate a hypothesis statement that guides your study.
Impact on Data Analysis
In scientific research, hypotheses are essential for analyzing data. They help you understand the significance and practical implications of your findings. Ultimately, the reader wants to know whether your hypothesis was proven true or false , so it must be written clearly in the introduction and/or abstract of your paper.
Steps in the Formulation of Hypothesis
Formulating a hypothesis is a crucial step in academic research. It involves several key stages that help ensure your hypothesis is both testable and relevant to your study.
Investigating Background Research
Before you can formulate a hypothesis, you need to conduct thorough background research . This involves reviewing existing literature to understand what has already been studied and identifying gaps in the current knowledge. Knowing how to find literature effectively is essential at this stage.
Formulating a Theory
Once you have a solid understanding of the existing research, the next step is to formulate a theory . This theory should be based on your background research and should aim to explain the phenomena you are studying. A well-formulated theory will guide your hypothesis development .
Testing the Theory
The final step is to design a method to test your theory . This involves identifying the variables you will study and determining how you will measure them. Your hypothesis should make clear, testable predictions about the relationships between these variables.
Types of Hypotheses in Research
In academic research, hypotheses are essential tools that guide the investigative process. They are typically categorized into different types, each serving a distinct role in framing the research inquiry.
Null Hypothesis
A null hypothesis is a statement that there is no relationship between two variables. It is often used to support the researcher's findings by showing that any observed effects are due to chance. For example, in a study on memory performance and depression, the null hypothesis might state that depression has no effect on memory performance .
Alternative Hypothesis
An alternative hypothesis predicts a relationship between the variables being studied. This type of hypothesis is used to show that there is a significant effect or relationship. For instance, in the same study on memory performance and depression, the alternative hypothesis might suggest that higher levels of depression lead to lower memory performance .
Directional and Non-directional Hypotheses
Directional hypotheses specify the expected direction of the relationship between variables. For example, a directional hypothesis might state that increased study time leads to better exam scores. Non-directional hypotheses, on the other hand, do not specify the direction but merely state that a relationship exists. For example, a non-directional hypothesis might state that there is a relationship between study time and exam scores without specifying whether it is positive or negative.
Understanding these types of hypotheses is crucial for navigating challenges in experimental research , as they help in structuring the research design and analysis effectively.
Theoretical Foundations for Hypothesis Formulation
Role of literature review.
When you start formulating a hypothesis, the first step is to conduct a thorough literature review. This involves examining existing research to understand what has already been discovered and where gaps exist. Formulating clear and precise research questions and hypotheses is essential for conducting effective and impactful studies. These elements provide the foundation for your research design and methodology.
Integration of Existing Theories
Theories are formulated to explain, predict, and understand phenomena and, in many cases, to challenge and extend existing knowledge within the limits of current assumptions. By integrating existing theories, you can build a robust framework for your hypothesis. This helps in proposing a tentative explanation about a phenomenon or a narrow set of phenomena observed in the natural world .
Identifying Research Gaps
Identifying research gaps is crucial for hypothesis formulation. Focus on theoretical framework, research gap, and methodology in master thesis writing . By pinpointing what has not yet been explored, you can formulate a hypothesis that addresses these gaps, thereby contributing new knowledge to your field.
Characteristics of a Good Hypothesis
Testability.
A good hypothesis must be testable. This means you should be able to design an experiment or study to verify or refute it. A hypothesis that cannot be tested is not useful in scientific research. For instance, if you propose that a certain teaching method improves student performance, you should be able to measure student performance to test this claim.
Clarity and Precision
Your hypothesis should be clear and precise. Avoid vague language and ensure that your hypothesis is specific enough to be understood and tested. For example, instead of saying "better teaching methods improve student performance," specify what you mean by "better teaching methods" and how you will measure "student performance."
Relevance to Research Question
A good hypothesis should be directly related to your research question. It should provide a clear direction for your study and help you focus on what you are trying to find out. Relevance ensures that your hypothesis is meaningful and that your research will contribute valuable insights to your field.
Literature Background
A good research hypothesis should have a sufficient literature background . The formulation of research hypothesis requires thorough research on certain topics. This helps in grounding your hypothesis in existing knowledge and theories, making it more robust and credible.
Identifying Variables
Identify variables (independent, dependent, control) and establish hypotheses for meaningful results. This step is crucial as it helps in defining what you are measuring and how you are measuring it. For example, if you are studying the effect of sleep on academic performance, your independent variable could be the amount of sleep, and your dependent variable could be academic performance.
Structured Approach
Strong hypotheses consist of three distinct parts : a definition of the problem, a proposed solution, and a result. This structured approach ensures that your hypothesis is well-thought-out and can be systematically tested. For example, "If students sleep for at least 8 hours, then their academic performance will improve, as measured by their test scores."
Common Pitfalls in Hypothesis Formulation
Overgeneralization.
When formulating a hypothesis, it's crucial to avoid making overly broad statements. Overgeneralization can lead to hypotheses that are not specific enough to be tested effectively. For instance, instead of hypothesizing that "exercise improves health," you should specify the type of exercise and the health outcomes you are measuring.
Lack of Clarity
A hypothesis must be clear and precise. Ambiguity can lead to confusion and misinterpretation of the research findings. Ensure that your hypothesis is straightforward and unambiguous, so that it can be easily understood and tested by others.
Ignoring Theoretical Frameworks
A strong hypothesis is grounded in a solid theoretical framework . Ignoring existing theories can result in a hypothesis that lacks scientific merit . Make sure to review the relevant literature and integrate existing theories into your hypothesis formulation process.
Hypothesis Testing in Quantitative Research
Statistical significance.
In quantitative research, hypothesis testing is a formal method for examining our ideas about the world using statistics. It involves formulating two competing hypotheses , the null hypothesis (H0) and the alternative hypothesis (Ha), and then collecting data to assess the evidence. Statistical significance helps determine if the observed data can reject the null hypothesis. In statistics, it's not possible to prove a hypothesis is true or false ; there is either evidence to suggest the null hypothesis is incorrect or not.
Inferential Tests
Inferential tests are used to make inferences about a population based on sample data. These tests help you decide whether to reject the null hypothesis. Common inferential tests include t-tests, chi-square tests, and ANOVA. Each test has its own criteria and is chosen based on the research design and data type. Choosing the right research methodology for a Ph.D. thesis is crucial , as quantitative research offers objectivity, generalizability, and replicability.
Interpreting Results
Interpreting the results of hypothesis testing involves several steps. First, state the hypotheses clearly. Next, formulate an analysis plan. Then, analyze the sample data. Finally, interpret the results to make a decision regarding the null hypothesis. The four steps of hypothesis testing include stating the hypotheses, formulating an analysis plan, analyzing the sample data, and analyzing the result. This structured approach ensures that the findings are reliable and valid.
Formulating Hypotheses in Qualitative Research
Exploratory nature.
In qualitative research, hypotheses are often more flexible and exploratory compared to their quantitative counterparts. This flexibility allows you to adapt and refine your hypotheses as new insights emerge during the study. Qualitative hypotheses are not always testable in the traditional sense but serve as guiding propositions that shape your research direction.
Flexibility in Hypothesis Development
The development of hypotheses in qualitative research is an iterative process. You may start with a broad proposition and narrow it down as you gather more data. This approach contrasts with the rigid structure often seen in quantitative research, where hypotheses are typically fixed before data collection begins. The iterative nature of qualitative research allows for continuous refinement and adjustment of your hypotheses.
Role of Subjectivity
Subjectivity plays a significant role in qualitative research. Your personal experiences, perspectives, and biases can influence the formulation and interpretation of hypotheses. While this subjectivity can add depth to your research, it is crucial to remain aware of it and strive for as much objectivity as possible. Clear documentation and guidelines can improve consistency and validity in your study.
Practical Examples of Hypothesis Formulation
Case studies.
Case studies are an excellent way to understand how hypotheses are formulated in real-world research. For instance, in a study examining the relationship between outdoor play and children's imagination, researchers might hypothesize that "Children who spend more time playing outside are more likely to be imaginative." This hypothesis is then tested through various methods, including observations and surveys.
Sample Hypotheses
Creating sample hypotheses can help you grasp the concept better. For example, a null hypothesis might state, "There is no meaningful relationship between the amount of time spent playing outside and the level of imagination in children." This type of hypothesis assumes no significant connection between the variables. On the other hand, an alternative hypothesis could be, "Children who spend more time playing outside exhibit higher levels of imagination." Formulating these hypotheses helps in setting a clear direction for your research.
Lessons Learned from Real-world Research
Real-world research offers valuable lessons in hypothesis formulation. One key takeaway is the importance of operationalization in research : turning abstract concepts into measurable realities. This involves defining how you will measure variables and ensuring they are testable. Another lesson is the need to avoid overgeneralization and maintain clarity. By learning from past research, you can better understand the steps involved in creating a strong, testable hypothesis for your own studies.
Ethical Considerations in Hypothesis Formulation
When formulating a hypothesis, it's crucial to adhere to ethical guidelines to maintain the integrity of your research. Avoiding bias is essential to ensure that your findings are credible and reliable. This means you should not let personal beliefs or preferences influence your hypothesis. Instead, base your hypothesis on objective evidence and sound reasoning.
Avoiding Bias
Bias can significantly skew your research results, leading to false conclusions. To avoid this, ensure that your hypothesis is grounded in objective data and not influenced by personal beliefs or external pressures. This will help maintain the credibility of your research.
Ensuring Objectivity
Objectivity is key in hypothesis formulation. Your hypothesis should be based on empirical evidence and logical reasoning rather than subjective opinions. This approach helps in producing reliable and valid results that can withstand scrutiny.
Maintaining Integrity in Research
Integrity in research involves being honest and transparent about your methods, data, and findings. This includes accurately reporting your results, even if they do not support your hypothesis. Upholding integrity ensures that your research contributes valuable knowledge to the academic community.
When forming a hypothesis, it's crucial to think about the ethical side of things. This means making sure your research is fair and honest. If you're a student struggling with this, we can help. Our step-by-step Thesis Action Plan is designed to guide you through every part of your thesis, making the process less stressful. Visit our website to learn more and get started today!
In summary, formulating a hypothesis is a crucial step in academic research. It serves as a predictive statement that guides the direction of the study and helps in testing the research question. By following a structured approach, researchers can develop testable hypotheses that are grounded in theoretical foundations and previous studies. This process not only clarifies what the research aims to investigate but also ensures that the study is methodically planned and executed. Understanding the formulation of hypotheses is essential for conducting meaningful and reliable research.
Frequently Asked Questions
What is a hypothesis.
A hypothesis is a statement that predicts what you think will happen in your study. It's like a guess based on what you already know.
Why are hypotheses important in research?
Hypotheses help guide your study. They tell you what you are trying to find out and keep you focused.
What are the steps to formulating a hypothesis?
First, you look at what other people have found. Then, you come up with your own idea. Finally, you figure out how to test your idea.
What is a null hypothesis?
A null hypothesis says that there is no effect or no difference. It's what you try to disprove in your study.
What is an alternative hypothesis?
An alternative hypothesis is the opposite of the null hypothesis. It says that there is an effect or a difference.
What makes a good hypothesis?
A good hypothesis is clear, can be tested, and is related to your research question.
What are common mistakes when making a hypothesis?
Common mistakes include making it too broad, not being clear, and ignoring existing theories.
How do you test a hypothesis?
In quantitative research, you use statistical tests to see if your hypothesis is supported by the data.

Discovering Statistics Using IBM SPSS Statistics: A Fun and Informative Guide

Unlocking the Power of Data: A Review of 'Essentials of Modern Business Statistics with Microsoft Excel'

Discovering Statistics Using SAS: A Comprehensive Review

Trending Topics for Your Thesis: What's Hot in 2024

How to Deal with a Total Lack of Motivation, Stress, and Anxiety When Finishing Your Master's Thesis

Mastering the First Step: How to Start Your Thesis with Confidence

Thesis Action Plan

- Blog Articles
- Affiliate Program
- Terms and Conditions
- Payment and Shipping Terms
- Privacy Policy
- Return Policy
© 2024 Research Rebels, All rights reserved.
Your cart is currently empty.
Definition of a Hypothesis
What it is and how it's used in sociology
- Key Concepts
- Major Sociologists
- News & Issues
- Research, Samples, and Statistics
- Recommended Reading
- Archaeology
A hypothesis is a prediction of what will be found at the outcome of a research project and is typically focused on the relationship between two different variables studied in the research. It is usually based on both theoretical expectations about how things work and already existing scientific evidence.
Within social science, a hypothesis can take two forms. It can predict that there is no relationship between two variables, in which case it is a null hypothesis . Or, it can predict the existence of a relationship between variables, which is known as an alternative hypothesis.
In either case, the variable that is thought to either affect or not affect the outcome is known as the independent variable, and the variable that is thought to either be affected or not is the dependent variable.
Researchers seek to determine whether or not their hypothesis, or hypotheses if they have more than one, will prove true. Sometimes they do, and sometimes they do not. Either way, the research is considered successful if one can conclude whether or not a hypothesis is true.
Null Hypothesis
A researcher has a null hypothesis when she or he believes, based on theory and existing scientific evidence, that there will not be a relationship between two variables. For example, when examining what factors influence a person's highest level of education within the U.S., a researcher might expect that place of birth, number of siblings, and religion would not have an impact on the level of education. This would mean the researcher has stated three null hypotheses.
Alternative Hypothesis
Taking the same example, a researcher might expect that the economic class and educational attainment of one's parents, and the race of the person in question are likely to have an effect on one's educational attainment. Existing evidence and social theories that recognize the connections between wealth and cultural resources , and how race affects access to rights and resources in the U.S. , would suggest that both economic class and educational attainment of the one's parents would have a positive effect on educational attainment. In this case, economic class and educational attainment of one's parents are independent variables, and one's educational attainment is the dependent variable—it is hypothesized to be dependent on the other two.
Conversely, an informed researcher would expect that being a race other than white in the U.S. is likely to have a negative impact on a person's educational attainment. This would be characterized as a negative relationship, wherein being a person of color has a negative effect on one's educational attainment. In reality, this hypothesis proves true, with the exception of Asian Americans , who go to college at a higher rate than whites do. However, Blacks and Hispanics and Latinos are far less likely than whites and Asian Americans to go to college.
Formulating a Hypothesis
Formulating a hypothesis can take place at the very beginning of a research project , or after a bit of research has already been done. Sometimes a researcher knows right from the start which variables she is interested in studying, and she may already have a hunch about their relationships. Other times, a researcher may have an interest in a particular topic, trend, or phenomenon, but he may not know enough about it to identify variables or formulate a hypothesis.
Whenever a hypothesis is formulated, the most important thing is to be precise about what one's variables are, what the nature of the relationship between them might be, and how one can go about conducting a study of them.
Updated by Nicki Lisa Cole, Ph.D
- What It Means When a Variable Is Spurious
- Understanding Path Analysis
- Pilot Study in Research
- Simple Random Sampling
- Exploitation
- What Is Multiculturalism? Definition, Theories, and Examples
- Convenience Samples for Research
- What Is Cultural Capital? Do I Have It?
- What Does Consumerism Mean?
- Visualizing Social Stratification in the U.S.
- What Is Symbolic Interactionism?
- What Is Cultural Hegemony?
- Understanding Stratified Samples and How to Make Them
- What Is Groupthink? Definition and Examples
- What Is a Reference Group?
- What Is Ethnography?
- Bipolar Disorder
- Therapy Center
- When To See a Therapist
- Types of Therapy
- Best Online Therapy
- Best Couples Therapy
- Managing Stress
- Sleep and Dreaming
- Understanding Emotions
- Self-Improvement
- Healthy Relationships
- Student Resources
- Personality Types
- Sweepstakes
- Guided Meditations
- Verywell Mind Insights
- 2024 Verywell Mind 25
- Mental Health in the Classroom
- Editorial Process
- Meet Our Review Board
- Crisis Support
How to Write a Great Hypothesis
Hypothesis Definition, Format, Examples, and Tips
Verywell / Alex Dos Diaz
- The Scientific Method
Hypothesis Format
Falsifiability of a hypothesis.
- Operationalization
Hypothesis Types
Hypotheses examples.
- Collecting Data
A hypothesis is a tentative statement about the relationship between two or more variables. It is a specific, testable prediction about what you expect to happen in a study. It is a preliminary answer to your question that helps guide the research process.
Consider a study designed to examine the relationship between sleep deprivation and test performance. The hypothesis might be: "This study is designed to assess the hypothesis that sleep-deprived people will perform worse on a test than individuals who are not sleep-deprived."
At a Glance
A hypothesis is crucial to scientific research because it offers a clear direction for what the researchers are looking to find. This allows them to design experiments to test their predictions and add to our scientific knowledge about the world. This article explores how a hypothesis is used in psychology research, how to write a good hypothesis, and the different types of hypotheses you might use.
The Hypothesis in the Scientific Method
In the scientific method , whether it involves research in psychology, biology, or some other area, a hypothesis represents what the researchers think will happen in an experiment. The scientific method involves the following steps:
- Forming a question
- Performing background research
- Creating a hypothesis
- Designing an experiment
- Collecting data
- Analyzing the results
- Drawing conclusions
- Communicating the results
The hypothesis is a prediction, but it involves more than a guess. Most of the time, the hypothesis begins with a question which is then explored through background research. At this point, researchers then begin to develop a testable hypothesis.
Unless you are creating an exploratory study, your hypothesis should always explain what you expect to happen.
In a study exploring the effects of a particular drug, the hypothesis might be that researchers expect the drug to have some type of effect on the symptoms of a specific illness. In psychology, the hypothesis might focus on how a certain aspect of the environment might influence a particular behavior.
Remember, a hypothesis does not have to be correct. While the hypothesis predicts what the researchers expect to see, the goal of the research is to determine whether this guess is right or wrong. When conducting an experiment, researchers might explore numerous factors to determine which ones might contribute to the ultimate outcome.
In many cases, researchers may find that the results of an experiment do not support the original hypothesis. When writing up these results, the researchers might suggest other options that should be explored in future studies.
In many cases, researchers might draw a hypothesis from a specific theory or build on previous research. For example, prior research has shown that stress can impact the immune system. So a researcher might hypothesize: "People with high-stress levels will be more likely to contract a common cold after being exposed to the virus than people who have low-stress levels."
In other instances, researchers might look at commonly held beliefs or folk wisdom. "Birds of a feather flock together" is one example of folk adage that a psychologist might try to investigate. The researcher might pose a specific hypothesis that "People tend to select romantic partners who are similar to them in interests and educational level."
Elements of a Good Hypothesis
So how do you write a good hypothesis? When trying to come up with a hypothesis for your research or experiments, ask yourself the following questions:
- Is your hypothesis based on your research on a topic?
- Can your hypothesis be tested?
- Does your hypothesis include independent and dependent variables?
Before you come up with a specific hypothesis, spend some time doing background research. Once you have completed a literature review, start thinking about potential questions you still have. Pay attention to the discussion section in the journal articles you read . Many authors will suggest questions that still need to be explored.
How to Formulate a Good Hypothesis
To form a hypothesis, you should take these steps:
- Collect as many observations about a topic or problem as you can.
- Evaluate these observations and look for possible causes of the problem.
- Create a list of possible explanations that you might want to explore.
- After you have developed some possible hypotheses, think of ways that you could confirm or disprove each hypothesis through experimentation. This is known as falsifiability.
In the scientific method , falsifiability is an important part of any valid hypothesis. In order to test a claim scientifically, it must be possible that the claim could be proven false.
Students sometimes confuse the idea of falsifiability with the idea that it means that something is false, which is not the case. What falsifiability means is that if something was false, then it is possible to demonstrate that it is false.
One of the hallmarks of pseudoscience is that it makes claims that cannot be refuted or proven false.
The Importance of Operational Definitions
A variable is a factor or element that can be changed and manipulated in ways that are observable and measurable. However, the researcher must also define how the variable will be manipulated and measured in the study.
Operational definitions are specific definitions for all relevant factors in a study. This process helps make vague or ambiguous concepts detailed and measurable.
For example, a researcher might operationally define the variable " test anxiety " as the results of a self-report measure of anxiety experienced during an exam. A "study habits" variable might be defined by the amount of studying that actually occurs as measured by time.
These precise descriptions are important because many things can be measured in various ways. Clearly defining these variables and how they are measured helps ensure that other researchers can replicate your results.
Replicability
One of the basic principles of any type of scientific research is that the results must be replicable.
Replication means repeating an experiment in the same way to produce the same results. By clearly detailing the specifics of how the variables were measured and manipulated, other researchers can better understand the results and repeat the study if needed.
Some variables are more difficult than others to define. For example, how would you operationally define a variable such as aggression ? For obvious ethical reasons, researchers cannot create a situation in which a person behaves aggressively toward others.
To measure this variable, the researcher must devise a measurement that assesses aggressive behavior without harming others. The researcher might utilize a simulated task to measure aggressiveness in this situation.
Hypothesis Checklist
- Does your hypothesis focus on something that you can actually test?
- Does your hypothesis include both an independent and dependent variable?
- Can you manipulate the variables?
- Can your hypothesis be tested without violating ethical standards?
The hypothesis you use will depend on what you are investigating and hoping to find. Some of the main types of hypotheses that you might use include:
- Simple hypothesis : This type of hypothesis suggests there is a relationship between one independent variable and one dependent variable.
- Complex hypothesis : This type suggests a relationship between three or more variables, such as two independent and dependent variables.
- Null hypothesis : This hypothesis suggests no relationship exists between two or more variables.
- Alternative hypothesis : This hypothesis states the opposite of the null hypothesis.
- Statistical hypothesis : This hypothesis uses statistical analysis to evaluate a representative population sample and then generalizes the findings to the larger group.
- Logical hypothesis : This hypothesis assumes a relationship between variables without collecting data or evidence.
A hypothesis often follows a basic format of "If {this happens} then {this will happen}." One way to structure your hypothesis is to describe what will happen to the dependent variable if you change the independent variable .
The basic format might be: "If {these changes are made to a certain independent variable}, then we will observe {a change in a specific dependent variable}."
A few examples of simple hypotheses:
- "Students who eat breakfast will perform better on a math exam than students who do not eat breakfast."
- "Students who experience test anxiety before an English exam will get lower scores than students who do not experience test anxiety."
- "Motorists who talk on the phone while driving will be more likely to make errors on a driving course than those who do not talk on the phone."
- "Children who receive a new reading intervention will have higher reading scores than students who do not receive the intervention."
Examples of a complex hypothesis include:
- "People with high-sugar diets and sedentary activity levels are more likely to develop depression."
- "Younger people who are regularly exposed to green, outdoor areas have better subjective well-being than older adults who have limited exposure to green spaces."
Examples of a null hypothesis include:
- "There is no difference in anxiety levels between people who take St. John's wort supplements and those who do not."
- "There is no difference in scores on a memory recall task between children and adults."
- "There is no difference in aggression levels between children who play first-person shooter games and those who do not."
Examples of an alternative hypothesis:
- "People who take St. John's wort supplements will have less anxiety than those who do not."
- "Adults will perform better on a memory task than children."
- "Children who play first-person shooter games will show higher levels of aggression than children who do not."
Collecting Data on Your Hypothesis
Once a researcher has formed a testable hypothesis, the next step is to select a research design and start collecting data. The research method depends largely on exactly what they are studying. There are two basic types of research methods: descriptive research and experimental research.
Descriptive Research Methods
Descriptive research such as case studies , naturalistic observations , and surveys are often used when conducting an experiment is difficult or impossible. These methods are best used to describe different aspects of a behavior or psychological phenomenon.
Once a researcher has collected data using descriptive methods, a correlational study can examine how the variables are related. This research method might be used to investigate a hypothesis that is difficult to test experimentally.
Experimental Research Methods
Experimental methods are used to demonstrate causal relationships between variables. In an experiment, the researcher systematically manipulates a variable of interest (known as the independent variable) and measures the effect on another variable (known as the dependent variable).
Unlike correlational studies, which can only be used to determine if there is a relationship between two variables, experimental methods can be used to determine the actual nature of the relationship—whether changes in one variable actually cause another to change.
The hypothesis is a critical part of any scientific exploration. It represents what researchers expect to find in a study or experiment. In situations where the hypothesis is unsupported by the research, the research still has value. Such research helps us better understand how different aspects of the natural world relate to one another. It also helps us develop new hypotheses that can then be tested in the future.
Thompson WH, Skau S. On the scope of scientific hypotheses . R Soc Open Sci . 2023;10(8):230607. doi:10.1098/rsos.230607
Taran S, Adhikari NKJ, Fan E. Falsifiability in medicine: what clinicians can learn from Karl Popper [published correction appears in Intensive Care Med. 2021 Jun 17;:]. Intensive Care Med . 2021;47(9):1054-1056. doi:10.1007/s00134-021-06432-z
Eyler AA. Research Methods for Public Health . 1st ed. Springer Publishing Company; 2020. doi:10.1891/9780826182067.0004
Nosek BA, Errington TM. What is replication ? PLoS Biol . 2020;18(3):e3000691. doi:10.1371/journal.pbio.3000691
Aggarwal R, Ranganathan P. Study designs: Part 2 - Descriptive studies . Perspect Clin Res . 2019;10(1):34-36. doi:10.4103/picr.PICR_154_18
Nevid J. Psychology: Concepts and Applications. Wadworth, 2013.
By Kendra Cherry, MSEd Kendra Cherry, MS, is a psychosocial rehabilitation specialist, psychology educator, and author of the "Everything Psychology Book."
- History & Society
- Science & Tech
- Biographies
- Animals & Nature
- Geography & Travel
- Arts & Culture
- Games & Quizzes
- On This Day
- One Good Fact
- New Articles
- Lifestyles & Social Issues
- Philosophy & Religion
- Politics, Law & Government
- World History
- Health & Medicine
- Browse Biographies
- Birds, Reptiles & Other Vertebrates
- Bugs, Mollusks & Other Invertebrates
- Environment
- Fossils & Geologic Time
- Entertainment & Pop Culture
- Sports & Recreation
- Visual Arts
- Demystified
- Image Galleries
- Infographics
- Top Questions
- Britannica Kids
- Saving Earth
- Space Next 50
- Student Center

- When did science begin?
- Where was science invented?

scientific hypothesis
Our editors will review what you’ve submitted and determine whether to revise the article.
- National Center for Biotechnology Information - PubMed Central - On the scope of scientific hypotheses
- LiveScience - What is a scientific hypothesis?
- The Royal Society - Open Science - On the scope of scientific hypotheses

scientific hypothesis , an idea that proposes a tentative explanation about a phenomenon or a narrow set of phenomena observed in the natural world. The two primary features of a scientific hypothesis are falsifiability and testability, which are reflected in an “If…then” statement summarizing the idea and in the ability to be supported or refuted through observation and experimentation. The notion of the scientific hypothesis as both falsifiable and testable was advanced in the mid-20th century by Austrian-born British philosopher Karl Popper .
The formulation and testing of a hypothesis is part of the scientific method , the approach scientists use when attempting to understand and test ideas about natural phenomena. The generation of a hypothesis frequently is described as a creative process and is based on existing scientific knowledge, intuition , or experience. Therefore, although scientific hypotheses commonly are described as educated guesses, they actually are more informed than a guess. In addition, scientists generally strive to develop simple hypotheses, since these are easier to test relative to hypotheses that involve many different variables and potential outcomes. Such complex hypotheses may be developed as scientific models ( see scientific modeling ).
Depending on the results of scientific evaluation, a hypothesis typically is either rejected as false or accepted as true. However, because a hypothesis inherently is falsifiable, even hypotheses supported by scientific evidence and accepted as true are susceptible to rejection later, when new evidence has become available. In some instances, rather than rejecting a hypothesis because it has been falsified by new evidence, scientists simply adapt the existing idea to accommodate the new information. In this sense a hypothesis is never incorrect but only incomplete.
The investigation of scientific hypotheses is an important component in the development of scientific theory . Hence, hypotheses differ fundamentally from theories; whereas the former is a specific tentative explanation and serves as the main tool by which scientists gather data, the latter is a broad general explanation that incorporates data from many different scientific investigations undertaken to explore hypotheses.
Countless hypotheses have been developed and tested throughout the history of science . Several examples include the idea that living organisms develop from nonliving matter, which formed the basis of spontaneous generation , a hypothesis that ultimately was disproved (first in 1668, with the experiments of Italian physician Francesco Redi , and later in 1859, with the experiments of French chemist and microbiologist Louis Pasteur ); the concept proposed in the late 19th century that microorganisms cause certain diseases (now known as germ theory ); and the notion that oceanic crust forms along submarine mountain zones and spreads laterally away from them ( seafloor spreading hypothesis ).
Educational resources and simple solutions for your research journey

What is a Research Hypothesis: How to Write it, Types, and Examples
Any research begins with a research question and a research hypothesis . A research question alone may not suffice to design the experiment(s) needed to answer it. A hypothesis is central to the scientific method. But what is a hypothesis ? A hypothesis is a testable statement that proposes a possible explanation to a phenomenon, and it may include a prediction. Next, you may ask what is a research hypothesis ? Simply put, a research hypothesis is a prediction or educated guess about the relationship between the variables that you want to investigate.
It is important to be thorough when developing your research hypothesis. Shortcomings in the framing of a hypothesis can affect the study design and the results. A better understanding of the research hypothesis definition and characteristics of a good hypothesis will make it easier for you to develop your own hypothesis for your research. Let’s dive in to know more about the types of research hypothesis , how to write a research hypothesis , and some research hypothesis examples .
Table of Contents
What is a hypothesis ?
A hypothesis is based on the existing body of knowledge in a study area. Framed before the data are collected, a hypothesis states the tentative relationship between independent and dependent variables, along with a prediction of the outcome.
What is a research hypothesis ?
Young researchers starting out their journey are usually brimming with questions like “ What is a hypothesis ?” “ What is a research hypothesis ?” “How can I write a good research hypothesis ?”
A research hypothesis is a statement that proposes a possible explanation for an observable phenomenon or pattern. It guides the direction of a study and predicts the outcome of the investigation. A research hypothesis is testable, i.e., it can be supported or disproven through experimentation or observation.

Characteristics of a good hypothesis
Here are the characteristics of a good hypothesis :
- Clearly formulated and free of language errors and ambiguity
- Concise and not unnecessarily verbose
- Has clearly defined variables
- Testable and stated in a way that allows for it to be disproven
- Can be tested using a research design that is feasible, ethical, and practical
- Specific and relevant to the research problem
- Rooted in a thorough literature search
- Can generate new knowledge or understanding.
How to create an effective research hypothesis
A study begins with the formulation of a research question. A researcher then performs background research. This background information forms the basis for building a good research hypothesis . The researcher then performs experiments, collects, and analyzes the data, interprets the findings, and ultimately, determines if the findings support or negate the original hypothesis.
Let’s look at each step for creating an effective, testable, and good research hypothesis :
- Identify a research problem or question: Start by identifying a specific research problem.
- Review the literature: Conduct an in-depth review of the existing literature related to the research problem to grasp the current knowledge and gaps in the field.
- Formulate a clear and testable hypothesis : Based on the research question, use existing knowledge to form a clear and testable hypothesis . The hypothesis should state a predicted relationship between two or more variables that can be measured and manipulated. Improve the original draft till it is clear and meaningful.
- State the null hypothesis: The null hypothesis is a statement that there is no relationship between the variables you are studying.
- Define the population and sample: Clearly define the population you are studying and the sample you will be using for your research.
- Select appropriate methods for testing the hypothesis: Select appropriate research methods, such as experiments, surveys, or observational studies, which will allow you to test your research hypothesis .
Remember that creating a research hypothesis is an iterative process, i.e., you might have to revise it based on the data you collect. You may need to test and reject several hypotheses before answering the research problem.
How to write a research hypothesis
When you start writing a research hypothesis , you use an “if–then” statement format, which states the predicted relationship between two or more variables. Clearly identify the independent variables (the variables being changed) and the dependent variables (the variables being measured), as well as the population you are studying. Review and revise your hypothesis as needed.
An example of a research hypothesis in this format is as follows:
“ If [athletes] follow [cold water showers daily], then their [endurance] increases.”
Population: athletes
Independent variable: daily cold water showers
Dependent variable: endurance
You may have understood the characteristics of a good hypothesis . But note that a research hypothesis is not always confirmed; a researcher should be prepared to accept or reject the hypothesis based on the study findings.

Research hypothesis checklist
Following from above, here is a 10-point checklist for a good research hypothesis :
- Testable: A research hypothesis should be able to be tested via experimentation or observation.
- Specific: A research hypothesis should clearly state the relationship between the variables being studied.
- Based on prior research: A research hypothesis should be based on existing knowledge and previous research in the field.
- Falsifiable: A research hypothesis should be able to be disproven through testing.
- Clear and concise: A research hypothesis should be stated in a clear and concise manner.
- Logical: A research hypothesis should be logical and consistent with current understanding of the subject.
- Relevant: A research hypothesis should be relevant to the research question and objectives.
- Feasible: A research hypothesis should be feasible to test within the scope of the study.
- Reflects the population: A research hypothesis should consider the population or sample being studied.
- Uncomplicated: A good research hypothesis is written in a way that is easy for the target audience to understand.
By following this research hypothesis checklist , you will be able to create a research hypothesis that is strong, well-constructed, and more likely to yield meaningful results.

Types of research hypothesis
Different types of research hypothesis are used in scientific research:
1. Null hypothesis:
A null hypothesis states that there is no change in the dependent variable due to changes to the independent variable. This means that the results are due to chance and are not significant. A null hypothesis is denoted as H0 and is stated as the opposite of what the alternative hypothesis states.
Example: “ The newly identified virus is not zoonotic .”
2. Alternative hypothesis:
This states that there is a significant difference or relationship between the variables being studied. It is denoted as H1 or Ha and is usually accepted or rejected in favor of the null hypothesis.
Example: “ The newly identified virus is zoonotic .”
3. Directional hypothesis :
This specifies the direction of the relationship or difference between variables; therefore, it tends to use terms like increase, decrease, positive, negative, more, or less.
Example: “ The inclusion of intervention X decreases infant mortality compared to the original treatment .”
4. Non-directional hypothesis:
While it does not predict the exact direction or nature of the relationship between the two variables, a non-directional hypothesis states the existence of a relationship or difference between variables but not the direction, nature, or magnitude of the relationship. A non-directional hypothesis may be used when there is no underlying theory or when findings contradict previous research.
Example, “ Cats and dogs differ in the amount of affection they express .”
5. Simple hypothesis :
A simple hypothesis only predicts the relationship between one independent and another independent variable.
Example: “ Applying sunscreen every day slows skin aging .”
6 . Complex hypothesis :
A complex hypothesis states the relationship or difference between two or more independent and dependent variables.
Example: “ Applying sunscreen every day slows skin aging, reduces sun burn, and reduces the chances of skin cancer .” (Here, the three dependent variables are slowing skin aging, reducing sun burn, and reducing the chances of skin cancer.)
7. Associative hypothesis:
An associative hypothesis states that a change in one variable results in the change of the other variable. The associative hypothesis defines interdependency between variables.
Example: “ There is a positive association between physical activity levels and overall health .”
8 . Causal hypothesis:
A causal hypothesis proposes a cause-and-effect interaction between variables.
Example: “ Long-term alcohol use causes liver damage .”
Note that some of the types of research hypothesis mentioned above might overlap. The types of hypothesis chosen will depend on the research question and the objective of the study.

Research hypothesis examples
Here are some good research hypothesis examples :
“The use of a specific type of therapy will lead to a reduction in symptoms of depression in individuals with a history of major depressive disorder.”
“Providing educational interventions on healthy eating habits will result in weight loss in overweight individuals.”
“Plants that are exposed to certain types of music will grow taller than those that are not exposed to music.”
“The use of the plant growth regulator X will lead to an increase in the number of flowers produced by plants.”
Characteristics that make a research hypothesis weak are unclear variables, unoriginality, being too general or too vague, and being untestable. A weak hypothesis leads to weak research and improper methods.
Some bad research hypothesis examples (and the reasons why they are “bad”) are as follows:
“This study will show that treatment X is better than any other treatment . ” (This statement is not testable, too broad, and does not consider other treatments that may be effective.)
“This study will prove that this type of therapy is effective for all mental disorders . ” (This statement is too broad and not testable as mental disorders are complex and different disorders may respond differently to different types of therapy.)
“Plants can communicate with each other through telepathy . ” (This statement is not testable and lacks a scientific basis.)
Importance of testable hypothesis
If a research hypothesis is not testable, the results will not prove or disprove anything meaningful. The conclusions will be vague at best. A testable hypothesis helps a researcher focus on the study outcome and understand the implication of the question and the different variables involved. A testable hypothesis helps a researcher make precise predictions based on prior research.
To be considered testable, there must be a way to prove that the hypothesis is true or false; further, the results of the hypothesis must be reproducible.

Frequently Asked Questions (FAQs) on research hypothesis
1. What is the difference between research question and research hypothesis ?
A research question defines the problem and helps outline the study objective(s). It is an open-ended statement that is exploratory or probing in nature. Therefore, it does not make predictions or assumptions. It helps a researcher identify what information to collect. A research hypothesis , however, is a specific, testable prediction about the relationship between variables. Accordingly, it guides the study design and data analysis approach.
2. When to reject null hypothesis ?
A null hypothesis should be rejected when the evidence from a statistical test shows that it is unlikely to be true. This happens when the test statistic (e.g., p -value) is less than the defined significance level (e.g., 0.05). Rejecting the null hypothesis does not necessarily mean that the alternative hypothesis is true; it simply means that the evidence found is not compatible with the null hypothesis.
3. How can I be sure my hypothesis is testable?
A testable hypothesis should be specific and measurable, and it should state a clear relationship between variables that can be tested with data. To ensure that your hypothesis is testable, consider the following:
- Clearly define the key variables in your hypothesis. You should be able to measure and manipulate these variables in a way that allows you to test the hypothesis.
- The hypothesis should predict a specific outcome or relationship between variables that can be measured or quantified.
- You should be able to collect the necessary data within the constraints of your study.
- It should be possible for other researchers to replicate your study, using the same methods and variables.
- Your hypothesis should be testable by using appropriate statistical analysis techniques, so you can draw conclusions, and make inferences about the population from the sample data.
- The hypothesis should be able to be disproven or rejected through the collection of data.
4. How do I revise my research hypothesis if my data does not support it?
If your data does not support your research hypothesis , you will need to revise it or develop a new one. You should examine your data carefully and identify any patterns or anomalies, re-examine your research question, and/or revisit your theory to look for any alternative explanations for your results. Based on your review of the data, literature, and theories, modify your research hypothesis to better align it with the results you obtained. Use your revised hypothesis to guide your research design and data collection. It is important to remain objective throughout the process.
5. I am performing exploratory research. Do I need to formulate a research hypothesis?
As opposed to “confirmatory” research, where a researcher has some idea about the relationship between the variables under investigation, exploratory research (or hypothesis-generating research) looks into a completely new topic about which limited information is available. Therefore, the researcher will not have any prior hypotheses. In such cases, a researcher will need to develop a post-hoc hypothesis. A post-hoc research hypothesis is generated after these results are known.
6. How is a research hypothesis different from a research question?
A research question is an inquiry about a specific topic or phenomenon, typically expressed as a question. It seeks to explore and understand a particular aspect of the research subject. In contrast, a research hypothesis is a specific statement or prediction that suggests an expected relationship between variables. It is formulated based on existing knowledge or theories and guides the research design and data analysis.
7. Can a research hypothesis change during the research process?
Yes, research hypotheses can change during the research process. As researchers collect and analyze data, new insights and information may emerge that require modification or refinement of the initial hypotheses. This can be due to unexpected findings, limitations in the original hypotheses, or the need to explore additional dimensions of the research topic. Flexibility is crucial in research, allowing for adaptation and adjustment of hypotheses to align with the evolving understanding of the subject matter.
8. How many hypotheses should be included in a research study?
The number of research hypotheses in a research study varies depending on the nature and scope of the research. It is not necessary to have multiple hypotheses in every study. Some studies may have only one primary hypothesis, while others may have several related hypotheses. The number of hypotheses should be determined based on the research objectives, research questions, and the complexity of the research topic. It is important to ensure that the hypotheses are focused, testable, and directly related to the research aims.
9. Can research hypotheses be used in qualitative research?
Yes, research hypotheses can be used in qualitative research, although they are more commonly associated with quantitative research. In qualitative research, hypotheses may be formulated as tentative or exploratory statements that guide the investigation. Instead of testing hypotheses through statistical analysis, qualitative researchers may use the hypotheses to guide data collection and analysis, seeking to uncover patterns, themes, or relationships within the qualitative data. The emphasis in qualitative research is often on generating insights and understanding rather than confirming or rejecting specific research hypotheses through statistical testing.
Editage All Access is a subscription-based platform that unifies the best AI tools and services designed to speed up, simplify, and streamline every step of a researcher’s journey. The Editage All Access Pack is a one-of-a-kind subscription that unlocks full access to an AI writing assistant, literature recommender, journal finder, scientific illustration tool, and exclusive discounts on professional publication services from Editage.
Based on 22+ years of experience in academia, Editage All Access empowers researchers to put their best research forward and move closer to success. Explore our top AI Tools pack, AI Tools + Publication Services pack, or Build Your Own Plan. Find everything a researcher needs to succeed, all in one place – Get All Access now starting at just $14 a month !
Related Posts

How to Write a Dissertation: A Beginner’s Guide

Back to School – Lock-in All Access Pack for a Year at the Best Price
- Skip to main content
- Skip to primary sidebar
- Skip to footer
- QuestionPro

- Solutions Industries Gaming Automotive Sports and events Education Government Travel & Hospitality Financial Services Healthcare Cannabis Technology Use Case AskWhy Communities Audience Contactless surveys Mobile LivePolls Member Experience GDPR Positive People Science 360 Feedback Surveys
- Resources Blog eBooks Survey Templates Case Studies Training Help center
Home Market Research
Research Hypothesis: What It Is, Types + How to Develop?

A research study starts with a question. Researchers worldwide ask questions and create research hypotheses. The effectiveness of research relies on developing a good research hypothesis. Examples of research hypotheses can guide researchers in writing effective ones.
In this blog, we’ll learn what a research hypothesis is, why it’s important in research, and the different types used in science. We’ll also guide you through creating your research hypothesis and discussing ways to test and evaluate it.
What is a Research Hypothesis?
A hypothesis is like a guess or idea that you suggest to check if it’s true. A research hypothesis is a statement that brings up a question and predicts what might happen.
It’s really important in the scientific method and is used in experiments to figure things out. Essentially, it’s an educated guess about how things are connected in the research.
A research hypothesis usually includes pointing out the independent variable (the thing they’re changing or studying) and the dependent variable (the result they’re measuring or watching). It helps plan how to gather and analyze data to see if there’s evidence to support or deny the expected connection between these variables.
Importance of Hypothesis in Research
Hypotheses are really important in research. They help design studies, allow for practical testing, and add to our scientific knowledge. Their main role is to organize research projects, making them purposeful, focused, and valuable to the scientific community. Let’s look at some key reasons why they matter:
- A research hypothesis helps test theories.
A hypothesis plays a pivotal role in the scientific method by providing a basis for testing existing theories. For example, a hypothesis might test the predictive power of a psychological theory on human behavior.
- It serves as a great platform for investigation activities.
It serves as a launching pad for investigation activities, which offers researchers a clear starting point. A research hypothesis can explore the relationship between exercise and stress reduction.
- Hypothesis guides the research work or study.
A well-formulated hypothesis guides the entire research process. It ensures that the study remains focused and purposeful. For instance, a hypothesis about the impact of social media on interpersonal relationships provides clear guidance for a study.
- Hypothesis sometimes suggests theories.
In some cases, a hypothesis can suggest new theories or modifications to existing ones. For example, a hypothesis testing the effectiveness of a new drug might prompt a reconsideration of current medical theories.
- It helps in knowing the data needs.
A hypothesis clarifies the data requirements for a study, ensuring that researchers collect the necessary information—a hypothesis guiding the collection of demographic data to analyze the influence of age on a particular phenomenon.
- The hypothesis explains social phenomena.
Hypotheses are instrumental in explaining complex social phenomena. For instance, a hypothesis might explore the relationship between economic factors and crime rates in a given community.
- Hypothesis provides a relationship between phenomena for empirical Testing.
Hypotheses establish clear relationships between phenomena, paving the way for empirical testing. An example could be a hypothesis exploring the correlation between sleep patterns and academic performance.
- It helps in knowing the most suitable analysis technique.
A hypothesis guides researchers in selecting the most appropriate analysis techniques for their data. For example, a hypothesis focusing on the effectiveness of a teaching method may lead to the choice of statistical analyses best suited for educational research.
Characteristics of a Good Research Hypothesis
A hypothesis is a specific idea that you can test in a study. It often comes from looking at past research and theories. A good hypothesis usually starts with a research question that you can explore through background research. For it to be effective, consider these key characteristics:
- Clear and Focused Language: A good hypothesis uses clear and focused language to avoid confusion and ensure everyone understands it.
- Related to the Research Topic: The hypothesis should directly relate to the research topic, acting as a bridge between the specific question and the broader study.
- Testable: An effective hypothesis can be tested, meaning its prediction can be checked with real data to support or challenge the proposed relationship.
- Potential for Exploration: A good hypothesis often comes from a research question that invites further exploration. Doing background research helps find gaps and potential areas to investigate.
- Includes Variables: The hypothesis should clearly state both the independent and dependent variables, specifying the factors being studied and the expected outcomes.
- Ethical Considerations: Check if variables can be manipulated without breaking ethical standards. It’s crucial to maintain ethical research practices.
- Predicts Outcomes: The hypothesis should predict the expected relationship and outcome, acting as a roadmap for the study and guiding data collection and analysis.
- Simple and Concise: A good hypothesis avoids unnecessary complexity and is simple and concise, expressing the essence of the proposed relationship clearly.
- Clear and Assumption-Free: The hypothesis should be clear and free from assumptions about the reader’s prior knowledge, ensuring universal understanding.
- Observable and Testable Results: A strong hypothesis implies research that produces observable and testable results, making sure the study’s outcomes can be effectively measured and analyzed.
When you use these characteristics as a checklist, it can help you create a good research hypothesis. It’ll guide improving and strengthening the hypothesis, identifying any weaknesses, and making necessary changes. Crafting a hypothesis with these features helps you conduct a thorough and insightful research study.
Types of Research Hypotheses
The research hypothesis comes in various types, each serving a specific purpose in guiding the scientific investigation. Knowing the differences will make it easier for you to create your own hypothesis. Here’s an overview of the common types:
01. Null Hypothesis
The null hypothesis states that there is no connection between two considered variables or that two groups are unrelated. As discussed earlier, a hypothesis is an unproven assumption lacking sufficient supporting data. It serves as the statement researchers aim to disprove. It is testable, verifiable, and can be rejected.
For example, if you’re studying the relationship between Project A and Project B, assuming both projects are of equal standard is your null hypothesis. It needs to be specific for your study.
02. Alternative Hypothesis
The alternative hypothesis is basically another option to the null hypothesis. It involves looking for a significant change or alternative that could lead you to reject the null hypothesis. It’s a different idea compared to the null hypothesis.
When you create a null hypothesis, you’re making an educated guess about whether something is true or if there’s a connection between that thing and another variable. If the null view suggests something is correct, the alternative hypothesis says it’s incorrect.
For instance, if your null hypothesis is “I’m going to be $1000 richer,” the alternative hypothesis would be “I’m not going to get $1000 or be richer.”
03. Directional Hypothesis
The directional hypothesis predicts the direction of the relationship between independent and dependent variables. They specify whether the effect will be positive or negative.
If you increase your study hours, you will experience a positive association with your exam scores. This hypothesis suggests that as you increase the independent variable (study hours), there will also be an increase in the dependent variable (exam scores).
04. Non-directional Hypothesis
The non-directional hypothesis predicts the existence of a relationship between variables but does not specify the direction of the effect. It suggests that there will be a significant difference or relationship, but it does not predict the nature of that difference.
For example, you will find no notable difference in test scores between students who receive the educational intervention and those who do not. However, once you compare the test scores of the two groups, you will notice an important difference.
05. Simple Hypothesis
A simple hypothesis predicts a relationship between one dependent variable and one independent variable without specifying the nature of that relationship. It’s simple and usually used when we don’t know much about how the two things are connected.
For example, if you adopt effective study habits, you will achieve higher exam scores than those with poor study habits.
06. Complex Hypothesis
A complex hypothesis is an idea that specifies a relationship between multiple independent and dependent variables. It is a more detailed idea than a simple hypothesis.
While a simple view suggests a straightforward cause-and-effect relationship between two things, a complex hypothesis involves many factors and how they’re connected to each other.
For example, when you increase your study time, you tend to achieve higher exam scores. The connection between your study time and exam performance is affected by various factors, including the quality of your sleep, your motivation levels, and the effectiveness of your study techniques.
If you sleep well, stay highly motivated, and use effective study strategies, you may observe a more robust positive correlation between the time you spend studying and your exam scores, unlike those who may lack these factors.
07. Associative Hypothesis
An associative hypothesis proposes a connection between two things without saying that one causes the other. Basically, it suggests that when one thing changes, the other changes too, but it doesn’t claim that one thing is causing the change in the other.
For example, you will likely notice higher exam scores when you increase your study time. You can recognize an association between your study time and exam scores in this scenario.
Your hypothesis acknowledges a relationship between the two variables—your study time and exam scores—without asserting that increased study time directly causes higher exam scores. You need to consider that other factors, like motivation or learning style, could affect the observed association.
08. Causal Hypothesis
A causal hypothesis proposes a cause-and-effect relationship between two variables. It suggests that changes in one variable directly cause changes in another variable.
For example, when you increase your study time, you experience higher exam scores. This hypothesis suggests a direct cause-and-effect relationship, indicating that the more time you spend studying, the higher your exam scores. It assumes that changes in your study time directly influence changes in your exam performance.
09. Empirical Hypothesis
An empirical hypothesis is a statement based on things we can see and measure. It comes from direct observation or experiments and can be tested with real-world evidence. If an experiment proves a theory, it supports the idea and shows it’s not just a guess. This makes the statement more reliable than a wild guess.
For example, if you increase the dosage of a certain medication, you might observe a quicker recovery time for patients. Imagine you’re in charge of a clinical trial. In this trial, patients are given varying dosages of the medication, and you measure and compare their recovery times. This allows you to directly see the effects of different dosages on how fast patients recover.
This way, you can create a research hypothesis: “Increasing the dosage of a certain medication will lead to a faster recovery time for patients.”
10. Statistical Hypothesis
A statistical hypothesis is a statement or assumption about a population parameter that is the subject of an investigation. It serves as the basis for statistical analysis and testing. It is often tested using statistical methods to draw inferences about the larger population.
In a hypothesis test, statistical evidence is collected to either reject the null hypothesis in favor of the alternative hypothesis or fail to reject the null hypothesis due to insufficient evidence.
For example, let’s say you’re testing a new medicine. Your hypothesis could be that the medicine doesn’t really help patients get better. So, you collect data and use statistics to see if your guess is right or if the medicine actually makes a difference.
If the data strongly shows that the medicine does help, you say your guess was wrong, and the medicine does make a difference. But if the proof isn’t strong enough, you can stick with your original guess because you didn’t get enough evidence to change your mind.
How to Develop a Research Hypotheses?
Step 1: identify your research problem or topic..
Define the area of interest or the problem you want to investigate. Make sure it’s clear and well-defined.
Start by asking a question about your chosen topic. Consider the limitations of your research and create a straightforward problem related to your topic. Once you’ve done that, you can develop and test a hypothesis with evidence.
Step 2: Conduct a literature review
Review existing literature related to your research problem. This will help you understand the current state of knowledge in the field, identify gaps, and build a foundation for your hypothesis. Consider the following questions:
- What existing research has been conducted on your chosen topic?
- Are there any gaps or unanswered questions in the current literature?
- How will the existing literature contribute to the foundation of your research?
Step 3: Formulate your research question
Based on your literature review, create a specific and concise research question that addresses your identified problem. Your research question should be clear, focused, and relevant to your field of study.
Step 4: Identify variables
Determine the key variables involved in your research question. Variables are the factors or phenomena that you will study and manipulate to test your hypothesis.
- Independent Variable: The variable you manipulate or control.
- Dependent Variable: The variable you measure to observe the effect of the independent variable.
Step 5: State the Null hypothesis
The null hypothesis is a statement that there is no significant difference or effect. It serves as a baseline for comparison with the alternative hypothesis.
Step 6: Select appropriate methods for testing the hypothesis
Choose research methods that align with your study objectives, such as experiments, surveys, or observational studies. The selected methods enable you to test your research hypothesis effectively.
Creating a research hypothesis usually takes more than one try. Expect to make changes as you collect data. It’s normal to test and say no to a few hypotheses before you find the right answer to your research question.
Testing and Evaluating Hypotheses
Testing hypotheses is a really important part of research. It’s like the practical side of things. Here, real-world evidence will help you determine how different things are connected. Let’s explore the main steps in hypothesis testing:
- State your research hypothesis.
Before testing, clearly articulate your research hypothesis. This involves framing both a null hypothesis, suggesting no significant effect or relationship, and an alternative hypothesis, proposing the expected outcome.
- Collect data strategically.
Plan how you will gather information in a way that fits your study. Make sure your data collection method matches the things you’re studying.
Whether through surveys, observations, or experiments, this step demands precision and adherence to the established methodology. The quality of data collected directly influences the credibility of study outcomes.
- Perform an appropriate statistical test.
Choose a statistical test that aligns with the nature of your data and the hypotheses being tested. Whether it’s a t-test, chi-square test, ANOVA, or regression analysis, selecting the right statistical tool is paramount for accurate and reliable results.
- Decide if your idea was right or wrong.
Following the statistical analysis, evaluate the results in the context of your null hypothesis. You need to decide if you should reject your null hypothesis or not.
- Share what you found.
When discussing what you found in your research, be clear and organized. Say whether your idea was supported or not, and talk about what your results mean. Also, mention any limits to your study and suggest ideas for future research.
The Role of QuestionPro to Develop a Good Research Hypothesis
QuestionPro is a survey and research platform that provides tools for creating, distributing, and analyzing surveys. It plays a crucial role in the research process, especially when you’re in the initial stages of hypothesis development. Here’s how QuestionPro can help you to develop a good research hypothesis:
- Survey design and data collection: You can use the platform to create targeted questions that help you gather relevant data.
- Exploratory research: Through surveys and feedback mechanisms on QuestionPro, you can conduct exploratory research to understand the landscape of a particular subject.
- Literature review and background research: QuestionPro surveys can collect sample population opinions, experiences, and preferences. This data and a thorough literature evaluation can help you generate a well-grounded hypothesis by improving your research knowledge.
- Identifying variables: Using targeted survey questions, you can identify relevant variables related to their research topic.
- Testing assumptions: You can use surveys to informally test certain assumptions or hypotheses before formalizing a research hypothesis.
- Data analysis tools: QuestionPro provides tools for analyzing survey data. You can use these tools to identify the collected data’s patterns, correlations, or trends.
- Refining your hypotheses: As you collect data through QuestionPro, you can adjust your hypotheses based on the real-world responses you receive.
A research hypothesis is like a guide for researchers in science. It’s a well-thought-out idea that has been thoroughly tested. This idea is crucial as researchers can explore different fields, such as medicine, social sciences, and natural sciences. The research hypothesis links theories to real-world evidence and gives researchers a clear path to explore and make discoveries.
QuestionPro Research Suite is a helpful tool for researchers. It makes creating surveys, collecting data, and analyzing information easily. It supports all kinds of research, from exploring new ideas to forming hypotheses. With a focus on using data, it helps researchers do their best work.
Are you interested in learning more about QuestionPro Research Suite? Take advantage of QuestionPro’s free trial to get an initial look at its capabilities and realize the full potential of your research efforts.
LEARN MORE FREE TRIAL
MORE LIKE THIS

Experimental vs Observational Studies: Differences & Examples
Sep 5, 2024

Interactive Forms: Key Features, Benefits, Uses + Design Tips
Sep 4, 2024

Closed-Loop Management: The Key to Customer Centricity
Sep 3, 2024

Net Trust Score: Tool for Measuring Trust in Organization
Sep 2, 2024
Other categories
- Academic Research
- Artificial Intelligence
- Assessments
- Brand Awareness
- Case Studies
- Communities
- Consumer Insights
- Customer effort score
- Customer Engagement
- Customer Experience
- Customer Loyalty
- Customer Research
- Customer Satisfaction
- Employee Benefits
- Employee Engagement
- Employee Retention
- Friday Five
- General Data Protection Regulation
- Insights Hub
- Life@QuestionPro
- Market Research
- Mobile diaries
- Mobile Surveys
- New Features
- Online Communities
- Question Types
- Questionnaire
- QuestionPro Products
- Release Notes
- Research Tools and Apps
- Revenue at Risk
- Survey Templates
- Training Tips
- Tuesday CX Thoughts (TCXT)
- Uncategorized
- What’s Coming Up
- Workforce Intelligence
Research Hypothesis In Psychology: Types, & Examples
Saul McLeod, PhD
Editor-in-Chief for Simply Psychology
BSc (Hons) Psychology, MRes, PhD, University of Manchester
Saul McLeod, PhD., is a qualified psychology teacher with over 18 years of experience in further and higher education. He has been published in peer-reviewed journals, including the Journal of Clinical Psychology.
Learn about our Editorial Process
Olivia Guy-Evans, MSc
Associate Editor for Simply Psychology
BSc (Hons) Psychology, MSc Psychology of Education
Olivia Guy-Evans is a writer and associate editor for Simply Psychology. She has previously worked in healthcare and educational sectors.
On This Page:
A research hypothesis, in its plural form “hypotheses,” is a specific, testable prediction about the anticipated results of a study, established at its outset. It is a key component of the scientific method .
Hypotheses connect theory to data and guide the research process towards expanding scientific understanding
Some key points about hypotheses:
- A hypothesis expresses an expected pattern or relationship. It connects the variables under investigation.
- It is stated in clear, precise terms before any data collection or analysis occurs. This makes the hypothesis testable.
- A hypothesis must be falsifiable. It should be possible, even if unlikely in practice, to collect data that disconfirms rather than supports the hypothesis.
- Hypotheses guide research. Scientists design studies to explicitly evaluate hypotheses about how nature works.
- For a hypothesis to be valid, it must be testable against empirical evidence. The evidence can then confirm or disprove the testable predictions.
- Hypotheses are informed by background knowledge and observation, but go beyond what is already known to propose an explanation of how or why something occurs.
Predictions typically arise from a thorough knowledge of the research literature, curiosity about real-world problems or implications, and integrating this to advance theory. They build on existing literature while providing new insight.
Types of Research Hypotheses
Alternative hypothesis.
The research hypothesis is often called the alternative or experimental hypothesis in experimental research.
It typically suggests a potential relationship between two key variables: the independent variable, which the researcher manipulates, and the dependent variable, which is measured based on those changes.
The alternative hypothesis states a relationship exists between the two variables being studied (one variable affects the other).
A hypothesis is a testable statement or prediction about the relationship between two or more variables. It is a key component of the scientific method. Some key points about hypotheses:
- Important hypotheses lead to predictions that can be tested empirically. The evidence can then confirm or disprove the testable predictions.
In summary, a hypothesis is a precise, testable statement of what researchers expect to happen in a study and why. Hypotheses connect theory to data and guide the research process towards expanding scientific understanding.
An experimental hypothesis predicts what change(s) will occur in the dependent variable when the independent variable is manipulated.
It states that the results are not due to chance and are significant in supporting the theory being investigated.
The alternative hypothesis can be directional, indicating a specific direction of the effect, or non-directional, suggesting a difference without specifying its nature. It’s what researchers aim to support or demonstrate through their study.
Null Hypothesis
The null hypothesis states no relationship exists between the two variables being studied (one variable does not affect the other). There will be no changes in the dependent variable due to manipulating the independent variable.
It states results are due to chance and are not significant in supporting the idea being investigated.
The null hypothesis, positing no effect or relationship, is a foundational contrast to the research hypothesis in scientific inquiry. It establishes a baseline for statistical testing, promoting objectivity by initiating research from a neutral stance.
Many statistical methods are tailored to test the null hypothesis, determining the likelihood of observed results if no true effect exists.
This dual-hypothesis approach provides clarity, ensuring that research intentions are explicit, and fosters consistency across scientific studies, enhancing the standardization and interpretability of research outcomes.
Nondirectional Hypothesis
A non-directional hypothesis, also known as a two-tailed hypothesis, predicts that there is a difference or relationship between two variables but does not specify the direction of this relationship.
It merely indicates that a change or effect will occur without predicting which group will have higher or lower values.
For example, “There is a difference in performance between Group A and Group B” is a non-directional hypothesis.
Directional Hypothesis
A directional (one-tailed) hypothesis predicts the nature of the effect of the independent variable on the dependent variable. It predicts in which direction the change will take place. (i.e., greater, smaller, less, more)
It specifies whether one variable is greater, lesser, or different from another, rather than just indicating that there’s a difference without specifying its nature.
For example, “Exercise increases weight loss” is a directional hypothesis.

Falsifiability
The Falsification Principle, proposed by Karl Popper , is a way of demarcating science from non-science. It suggests that for a theory or hypothesis to be considered scientific, it must be testable and irrefutable.
Falsifiability emphasizes that scientific claims shouldn’t just be confirmable but should also have the potential to be proven wrong.
It means that there should exist some potential evidence or experiment that could prove the proposition false.
However many confirming instances exist for a theory, it only takes one counter observation to falsify it. For example, the hypothesis that “all swans are white,” can be falsified by observing a black swan.
For Popper, science should attempt to disprove a theory rather than attempt to continually provide evidence to support a research hypothesis.
Can a Hypothesis be Proven?
Hypotheses make probabilistic predictions. They state the expected outcome if a particular relationship exists. However, a study result supporting a hypothesis does not definitively prove it is true.
All studies have limitations. There may be unknown confounding factors or issues that limit the certainty of conclusions. Additional studies may yield different results.
In science, hypotheses can realistically only be supported with some degree of confidence, not proven. The process of science is to incrementally accumulate evidence for and against hypothesized relationships in an ongoing pursuit of better models and explanations that best fit the empirical data. But hypotheses remain open to revision and rejection if that is where the evidence leads.
- Disproving a hypothesis is definitive. Solid disconfirmatory evidence will falsify a hypothesis and require altering or discarding it based on the evidence.
- However, confirming evidence is always open to revision. Other explanations may account for the same results, and additional or contradictory evidence may emerge over time.
We can never 100% prove the alternative hypothesis. Instead, we see if we can disprove, or reject the null hypothesis.
If we reject the null hypothesis, this doesn’t mean that our alternative hypothesis is correct but does support the alternative/experimental hypothesis.
Upon analysis of the results, an alternative hypothesis can be rejected or supported, but it can never be proven to be correct. We must avoid any reference to results proving a theory as this implies 100% certainty, and there is always a chance that evidence may exist which could refute a theory.
How to Write a Hypothesis
- Identify variables . The researcher manipulates the independent variable and the dependent variable is the measured outcome.
- Operationalized the variables being investigated . Operationalization of a hypothesis refers to the process of making the variables physically measurable or testable, e.g. if you are about to study aggression, you might count the number of punches given by participants.
- Decide on a direction for your prediction . If there is evidence in the literature to support a specific effect of the independent variable on the dependent variable, write a directional (one-tailed) hypothesis. If there are limited or ambiguous findings in the literature regarding the effect of the independent variable on the dependent variable, write a non-directional (two-tailed) hypothesis.
- Make it Testable : Ensure your hypothesis can be tested through experimentation or observation. It should be possible to prove it false (principle of falsifiability).
- Clear & concise language . A strong hypothesis is concise (typically one to two sentences long), and formulated using clear and straightforward language, ensuring it’s easily understood and testable.
Consider a hypothesis many teachers might subscribe to: students work better on Monday morning than on Friday afternoon (IV=Day, DV= Standard of work).
Now, if we decide to study this by giving the same group of students a lesson on a Monday morning and a Friday afternoon and then measuring their immediate recall of the material covered in each session, we would end up with the following:
- The alternative hypothesis states that students will recall significantly more information on a Monday morning than on a Friday afternoon.
- The null hypothesis states that there will be no significant difference in the amount recalled on a Monday morning compared to a Friday afternoon. Any difference will be due to chance or confounding factors.
More Examples
- Memory : Participants exposed to classical music during study sessions will recall more items from a list than those who studied in silence.
- Social Psychology : Individuals who frequently engage in social media use will report higher levels of perceived social isolation compared to those who use it infrequently.
- Developmental Psychology : Children who engage in regular imaginative play have better problem-solving skills than those who don’t.
- Clinical Psychology : Cognitive-behavioral therapy will be more effective in reducing symptoms of anxiety over a 6-month period compared to traditional talk therapy.
- Cognitive Psychology : Individuals who multitask between various electronic devices will have shorter attention spans on focused tasks than those who single-task.
- Health Psychology : Patients who practice mindfulness meditation will experience lower levels of chronic pain compared to those who don’t meditate.
- Organizational Psychology : Employees in open-plan offices will report higher levels of stress than those in private offices.
- Behavioral Psychology : Rats rewarded with food after pressing a lever will press it more frequently than rats who receive no reward.
How to Write a Hypothesis in 6 Steps, With Examples

A hypothesis is a statement that explains the predictions and reasoning of your research—an “educated guess” about how your scientific experiments will end. As a fundamental part of the scientific method, a good hypothesis is carefully written, but even the simplest ones can be difficult to put into words.
Want to know how to write a hypothesis for your academic paper ? Below we explain the different types of hypotheses, what a good hypothesis requires, the steps to write your own, and plenty of examples.
Write with confidence Grammarly helps you polish your academic writing Write with Grammarly
What is a hypothesis?
One of our 10 essential words for university success , a hypothesis is one of the earliest stages of the scientific method. It’s essentially an educated guess—based on observations—of what the results of your experiment or research will be.
Some hypothesis examples include:
- If I water plants daily they will grow faster.
- Adults can more accurately guess the temperature than children can.
- Butterflies prefer white flowers to orange ones.
If you’ve noticed that watering your plants every day makes them grow faster, your hypothesis might be “plants grow better with regular watering.” From there, you can begin experiments to test your hypothesis; in this example, you might set aside two plants, water one but not the other, and then record the results to see the differences.
The language of hypotheses always discusses variables , or the elements that you’re testing. Variables can be objects, events, concepts, etc.—whatever is observable.
There are two types of variables: independent and dependent. Independent variables are the ones that you change for your experiment, whereas dependent variables are the ones that you can only observe. In the above example, our independent variable is how often we water the plants and the dependent variable is how well they grow.
Hypotheses determine the direction and organization of your subsequent research methods, and that makes them a big part of writing a research paper . Ultimately the reader wants to know whether your hypothesis was proven true or false, so it must be written clearly in the introduction and/or abstract of your paper.
7 examples of hypotheses
Depending on the nature of your research and what you expect to find, your hypothesis will fall into one or more of the seven main categories. Keep in mind that these categories are not exclusive, so the same hypothesis might qualify as several different types.
1 Simple hypothesis
A simple hypothesis suggests only the relationship between two variables: one independent and one dependent.
- If you stay up late, then you feel tired the next day.
- Turning off your phone makes it charge faster.
2 Complex hypothesis
A complex hypothesis suggests the relationship between more than two variables, for example, two independents and one dependent, or vice versa.
- People who both (1) eat a lot of fatty foods and (2) have a family history of health problems are more likely to develop heart diseases.
- Older people who live in rural areas are happier than younger people who live in rural areas.
3 Null hypothesis
A null hypothesis, abbreviated as H 0 , suggests that there is no relationship between variables.
- There is no difference in plant growth when using either bottled water or tap water.
- Professional psychics do not win the lottery more than other people.
4 Alternative hypothesis
An alternative hypothesis, abbreviated as H 1 or H A , is used in conjunction with a null hypothesis. It states the opposite of the null hypothesis, so that one and only one must be true.
- Plants grow better with bottled water than tap water.
- Professional psychics win the lottery more than other people.
5 Logical hypothesis
A logical hypothesis suggests a relationship between variables without actual evidence. Claims are instead based on reasoning or deduction, but lack actual data.
- An alien raised on Venus would have trouble breathing in Earth’s atmosphere.
- Dinosaurs with sharp, pointed teeth were probably carnivores.
6 Empirical hypothesis
An empirical hypothesis, also known as a “working hypothesis,” is one that is currently being tested. Unlike logical hypotheses, empirical hypotheses rely on concrete data.
- Customers at restaurants will tip the same even if the wait staff’s base salary is raised.
- Washing your hands every hour can reduce the frequency of illness.
7 Statistical hypothesis
A statistical hypothesis is when you test only a sample of a population and then apply statistical evidence to the results to draw a conclusion about the entire population. Instead of testing everything , you test only a portion and generalize the rest based on preexisting data.
- In humans, the birth-gender ratio of males to females is 1.05 to 1.00.
- Approximately 2% of the world population has natural red hair.
What makes a good hypothesis?
No matter what you’re testing, a good hypothesis is written according to the same guidelines. In particular, keep these five characteristics in mind:
Cause and effect
Hypotheses always include a cause-and-effect relationship where one variable causes another to change (or not change if you’re using a null hypothesis). This can best be reflected as an if-then statement: If one variable occurs, then another variable changes.
Testable prediction
Most hypotheses are designed to be tested (with the exception of logical hypotheses). Before committing to a hypothesis, make sure you’re actually able to conduct experiments on it. Choose a testable hypothesis with an independent variable that you have absolute control over.
Independent and dependent variables
Define your variables in your hypothesis so your readers understand the big picture. You don’t have to specifically say which ones are independent and dependent variables, but you definitely want to mention them all.
Candid language
Writing can easily get convoluted, so make sure your hypothesis remains as simple and clear as possible. Readers use your hypothesis as a contextual pillar to unify your entire paper, so there should be no confusion or ambiguity. If you’re unsure about your phrasing, try reading your hypothesis to a friend to see if they understand.
Adherence to ethics
It’s not always about what you can test, but what you should test. Avoid hypotheses that require questionable or taboo experiments to keep ethics (and therefore, credibility) intact.
How to write a hypothesis in 6 steps
1 ask a question.
Curiosity has inspired some of history’s greatest scientific achievements, so a good place to start is to ask yourself questions about the world around you. Why are things the way they are? What causes the factors you see around you? If you can, choose a research topic that you’re interested in so your curiosity comes naturally.
2 Conduct preliminary research
Next, collect some background information on your topic. How much background information you need depends on what you’re attempting. It could require reading several books, or it could be as simple as performing a web search for a quick answer. You don’t necessarily have to prove or disprove your hypothesis at this stage; rather, collect only what you need to prove or disprove it yourself.
3 Define your variables
Once you have an idea of what your hypothesis will be, select which variables are independent and which are dependent. Remember that independent variables can only be factors that you have absolute control over, so consider the limits of your experiment before finalizing your hypothesis.
4 Phrase it as an if-then statement
When writing a hypothesis, it helps to phrase it using an if-then format, such as, “ If I water a plant every day, then it will grow better.” This format can get tricky when dealing with multiple variables, but in general, it’s a reliable method for expressing the cause-and-effect relationship you’re testing.
5 Collect data to support your hypothesis
A hypothesis is merely a means to an end. The priority of any scientific research is the conclusion. Once you have your hypothesis laid out and your variables chosen, you can then begin your experiments. Ideally, you’ll collect data to support your hypothesis, but don’t worry if your research ends up proving it wrong—that’s all part of the scientific method.
6 Write with confidence
Last, you’ll want to record your findings in a research paper for others to see. This requires a bit of writing know-how, quite a different skill set than conducting experiments.
That’s where Grammarly can be a major help; our writing suggestions point out not only grammar and spelling mistakes , but also new word choices and better phrasing. While you write, Grammarly automatically recommends optimal language and highlights areas where readers might get confused, ensuring that your hypothesis—and your final paper—are clear and polished.

The Research Hypothesis: Role and Construction
- First Online: 01 January 2012
Cite this chapter

- Phyllis G. Supino EdD 3
6118 Accesses
A hypothesis is a logical construct, interposed between a problem and its solution, which represents a proposed answer to a research question. It gives direction to the investigator’s thinking about the problem and, therefore, facilitates a solution. There are three primary modes of inference by which hypotheses are developed: deduction (reasoning from a general propositions to specific instances), induction (reasoning from specific instances to a general proposition), and abduction (formulation/acceptance on probation of a hypothesis to explain a surprising observation).
A research hypothesis should reflect an inference about variables; be stated as a grammatically complete, declarative sentence; be expressed simply and unambiguously; provide an adequate answer to the research problem; and be testable. Hypotheses can be classified as conceptual versus operational, single versus bi- or multivariable, causal or not causal, mechanistic versus nonmechanistic, and null or alternative. Hypotheses most commonly entail statements about “variables” which, in turn, can be classified according to their level of measurement (scaling characteristics) or according to their role in the hypothesis (independent, dependent, moderator, control, or intervening).
A hypothesis is rendered operational when its broadly (conceptually) stated variables are replaced by operational definitions of those variables. Hypotheses stated in this manner are called operational hypotheses, specific hypotheses, or predictions and facilitate testing.
Wrong hypotheses, rightly worked from, have produced more results than unguided observation
—Augustus De Morgan, 1872[ 1 ]—
This is a preview of subscription content, log in via an institution to check access.
Access this chapter
Subscribe and save.
- Get 10 units per month
- Download Article/Chapter or eBook
- 1 Unit = 1 Article or 1 Chapter
- Cancel anytime
- Available as PDF
- Read on any device
- Instant download
- Own it forever
- Available as EPUB and PDF
- Compact, lightweight edition
- Dispatched in 3 to 5 business days
- Free shipping worldwide - see info
- Durable hardcover edition
Tax calculation will be finalised at checkout
Purchases are for personal use only
Institutional subscriptions
The Nature and Logic of Science: Testing Hypotheses

Abductive Research Methods in Psychological Science

Abductive Research Methods in Psychological Science
De Morgan A, De Morgan S. A budget of paradoxes. London: Longmans Green; 1872.
Google Scholar
Leedy Paul D. Practical research. Planning and design. 2nd ed. New York: Macmillan; 1960.
Bernard C. Introduction to the study of experimental medicine. New York: Dover; 1957.
Erren TC. The quest for questions—on the logical force of science. Med Hypotheses. 2004;62:635–40.
Article PubMed Google Scholar
Peirce CS. Collected papers of Charles Sanders Peirce, vol. 7. In: Hartshorne C, Weiss P, editors. Boston: The Belknap Press of Harvard University Press; 1966.
Aristotle. The complete works of Aristotle: the revised Oxford Translation. In: Barnes J, editor. vol. 2. Princeton/New Jersey: Princeton University Press; 1984.
Polit D, Beck CT. Conceptualizing a study to generate evidence for nursing. In: Polit D, Beck CT, editors. Nursing research: generating and assessing evidence for nursing practice. 8th ed. Philadelphia: Wolters Kluwer/Lippincott Williams and Wilkins; 2008. Chapter 4.
Jenicek M, Hitchcock DL. Evidence-based practice. Logic and critical thinking in medicine. Chicago: AMA Press; 2005.
Bacon F. The novum organon or a true guide to the interpretation of nature. A new translation by the Rev G.W. Kitchin. Oxford: The University Press; 1855.
Popper KR. Objective knowledge: an evolutionary approach (revised edition). New York: Oxford University Press; 1979.
Morgan AJ, Parker S. Translational mini-review series on vaccines: the Edward Jenner Museum and the history of vaccination. Clin Exp Immunol. 2007;147:389–94.
Article PubMed CAS Google Scholar
Pead PJ. Benjamin Jesty: new light in the dawn of vaccination. Lancet. 2003;362:2104–9.
Lee JA. The scientific endeavor: a primer on scientific principles and practice. San Francisco: Addison-Wesley Longman; 2000.
Allchin D. Lawson’s shoehorn, or should the philosophy of science be rated, ‘X’? Science and Education. 2003;12:315–29.
Article Google Scholar
Lawson AE. What is the role of induction and deduction in reasoning and scientific inquiry? J Res Sci Teach. 2005;42:716–40.
Peirce CS. Collected papers of Charles Sanders Peirce, vol. 2. In: Hartshorne C, Weiss P, editors. Boston: The Belknap Press of Harvard University Press; 1965.
Bonfantini MA, Proni G. To guess or not to guess? In: Eco U, Sebeok T, editors. The sign of three: Dupin, Holmes, Peirce. Bloomington: Indiana University Press; 1983. Chapter 5.
Peirce CS. Collected papers of Charles Sanders Peirce, vol. 5. In: Hartshorne C, Weiss P, editors. Boston: The Belknap Press of Harvard University Press; 1965.
Flach PA, Kakas AC. Abductive and inductive reasoning: background issues. In: Flach PA, Kakas AC, editors. Abduction and induction. Essays on their relation and integration. The Netherlands: Klewer; 2000. Chapter 1.
Murray JF. Voltaire, Walpole and Pasteur: variations on the theme of discovery. Am J Respir Crit Care Med. 2005;172:423–6.
Danemark B, Ekstrom M, Jakobsen L, Karlsson JC. Methodological implications, generalization, scientific inference, models (Part II) In: explaining society. Critical realism in the social sciences. New York: Routledge; 2002.
Pasteur L. Inaugural lecture as professor and dean of the faculty of sciences. In: Peterson H, editor. A treasury of the world’s greatest speeches. Douai, France: University of Lille 7 Dec 1954.
Swineburne R. Simplicity as evidence for truth. Milwaukee: Marquette University Press; 1997.
Sakar S, editor. Logical empiricism at its peak: Schlick, Carnap and Neurath. New York: Garland; 1996.
Popper K. The logic of scientific discovery. New York: Basic Books; 1959. 1934, trans. 1959.
Caws P. The philosophy of science. Princeton: D. Van Nostrand Company; 1965.
Popper K. Conjectures and refutations. The growth of scientific knowledge. 4th ed. London: Routledge and Keegan Paul; 1972.
Feyerabend PK. Against method, outline of an anarchistic theory of knowledge. London, UK: Verso; 1978.
Smith PG. Popper: conjectures and refutations (Chapter IV). In: Theory and reality: an introduction to the philosophy of science. Chicago: University of Chicago Press; 2003.
Blystone RV, Blodgett K. WWW: the scientific method. CBE Life Sci Educ. 2006;5:7–11.
Kleinbaum DG, Kupper LL, Morgenstern H. Epidemiological research. Principles and quantitative methods. New York: Van Nostrand Reinhold; 1982.
Fortune AE, Reid WJ. Research in social work. 3rd ed. New York: Columbia University Press; 1999.
Kerlinger FN. Foundations of behavioral research. 1st ed. New York: Hold, Reinhart and Winston; 1970.
Hoskins CN, Mariano C. Research in nursing and health. Understanding and using quantitative and qualitative methods. New York: Springer; 2004.
Tuckman BW. Conducting educational research. New York: Harcourt, Brace, Jovanovich; 1972.
Wang C, Chiari PC, Weihrauch D, Krolikowski JG, Warltier DC, Kersten JR, Pratt Jr PF, Pagel PS. Gender-specificity of delayed preconditioning by isoflurane in rabbits: potential role of endothelial nitric oxide synthase. Anesth Analg. 2006;103:274–80.
Beyer ME, Slesak G, Nerz S, Kazmaier S, Hoffmeister HM. Effects of endothelin-1 and IRL 1620 on myocardial contractility and myocardial energy metabolism. J Cardiovasc Pharmacol. 1995;26(Suppl 3):S150–2.
PubMed CAS Google Scholar
Stone J, Sharpe M. Amnesia for childhood in patients with unexplained neurological symptoms. J Neurol Neurosurg Psychiatry. 2002;72:416–7.
Naughton BJ, Moran M, Ghaly Y, Michalakes C. Computer tomography scanning and delirium in elder patients. Acad Emerg Med. 1997;4:1107–10.
Easterbrook PJ, Berlin JA, Gopalan R, Matthews DR. Publication bias in clinical research. Lancet. 1991;337:867–72.
Stern JM, Simes RJ. Publication bias: evidence of delayed publication in a cohort study of clinical research projects. BMJ. 1997;315:640–5.
Stevens SS. On the theory of scales and measurement. Science. 1946;103:677–80.
Knapp TR. Treating ordinal scales as interval scales: an attempt to resolve the controversy. Nurs Res. 1990;39:121–3.
The Cochrane Collaboration. Open Learning Material. www.cochrane-net.org/openlearning/html/mod14-3.htm . Accessed 12 Oct 2009.
MacCorquodale K, Meehl PE. On a distinction between hypothetical constructs and intervening variables. Psychol Rev. 1948;55:95–107.
Baron RM, Kenny DA. The moderator-mediator variable distinction in social psychological research: conceptual, strategic and statistical considerations. J Pers Soc Psychol. 1986;51:1173–82.
Williamson GM, Schultz R. Activity restriction mediates the association between pain and depressed affect: a study of younger and older adult cancer patients. Psychol Aging. 1995;10:369–78.
Song M, Lee EO. Development of a functional capacity model for the elderly. Res Nurs Health. 1998;21:189–98.
MacKinnon DP. Introduction to statistical mediation analysis. New York: Routledge; 2008.
Download references
Author information
Authors and affiliations.
Department of Medicine, College of Medicine, SUNY Downstate Medical Center, 450 Clarkson Avenue, 1199, Brooklyn, NY, 11203, USA
Phyllis G. Supino EdD
You can also search for this author in PubMed Google Scholar
Corresponding author
Correspondence to Phyllis G. Supino EdD .
Editor information
Editors and affiliations.
, Cardiovascular Medicine, SUNY Downstate Medical Center, Clarkson Avenue, box 1199 450, Brooklyn, 11203, USA
Phyllis G. Supino
, Cardiovascualr Medicine, SUNY Downstate Medical Center, Clarkson Avenue 450, Brooklyn, 11203, USA
Jeffrey S. Borer
Rights and permissions
Reprints and permissions
Copyright information
© 2012 Springer Science+Business Media, LLC
About this chapter
Supino, P.G. (2012). The Research Hypothesis: Role and Construction. In: Supino, P., Borer, J. (eds) Principles of Research Methodology. Springer, New York, NY. https://doi.org/10.1007/978-1-4614-3360-6_3
Download citation
DOI : https://doi.org/10.1007/978-1-4614-3360-6_3
Published : 18 April 2012
Publisher Name : Springer, New York, NY
Print ISBN : 978-1-4614-3359-0
Online ISBN : 978-1-4614-3360-6
eBook Packages : Medicine Medicine (R0)
Share this chapter
Anyone you share the following link with will be able to read this content:
Sorry, a shareable link is not currently available for this article.
Provided by the Springer Nature SharedIt content-sharing initiative
- Publish with us
Policies and ethics
- Find a journal
- Track your research
Learning Materials
- Business Studies
- Combined Science
- Computer Science
- Engineering
- English Literature
- Environmental Science
- Human Geography
- Macroeconomics
- Microeconomics
- Formulation of Hypothesis
Children who spend more time playing outside are more likely to be imaginative. What do you think this statement is an example of in terms of scientific research ? If you guessed a hypothesis, then you'd be correct. The formulation of hypotheses is a fundamental step in psychology research.
Millions of flashcards designed to help you ace your studies
- Cell Biology
What type of hypothesis matches the following definition. A hypothesis that states that the IV will influence the DV, and states how it will influence the DV.
Which type of hypothesis is also known as a two-tailed hypothesis?
What type of hypothesis matches the following definition. A predictive statement that researchers use when it is thought that the IV will not influence the DV.
What type of hypothesis is the following example. There will be no observed difference in scores from a memory performance task between people with high- or low-depressive scores.
Is the following example a falsifiable hypothesis, "leprechauns always find the pot of gold at the end of the rainbow".
What type of hypothesis is the following example. There will be an observed difference in scores from a memory performance task between people with high- or low-depressive scores.
Is memory an operationalised variable that could be used in a good hypothesis?
What type of hypothesis is the following example. People with low depressive scores will perform better in the memory performance task than people who score higher in depressive symptoms.
What type of hypothesis matches the following definition. A hypothesis that states that the IV will influence the DV. But, the hypothesis does not state how the IV will influence the DV.
Review generated flashcards
to start learning or create your own AI flashcards
Start learning or create your own AI flashcards
- Approaches in Psychology
- Basic Psychology
- Biological Bases of Behavior
- Biopsychology
- Careers in Psychology
- Clinical Psychology
- Bartlett War of the Ghosts
- Brain Development
- Bruner and Minturn Study of Perceptual Set
- Case Studies Psychology
- Computation
- Conservation of Number Piaget
- Constructive Processes in Memory
- Correlation
- Data handling
- Depth Cues Psychology
- Designing Research
- Developmental Research
- Dweck's Theory of Mindset
- Ethical considerations in research
- Experimental Method
- Factors Affecting Perception
- Factors Affecting the Accuracy of Memory
- Gibson's Theory of Direct Perception
- Gregory's Constructivist Theory of Perception
- Gunderson et al 2013 study
- Hughes Policeman Doll Study
- Issues and Debates in Developmental Psychology
- Language and Perception
- McGarrigle and Donaldson Naughty Teddy
- Memory Processes
- Memory recall
- Nature and Nurture in Development
- Normal Distribution Psychology
- Perception Research
- Perceptual Set
- Piagets Theory in Education
- Planning and Conducting Research
- Population Samples
- Primary and Secondary Data
- Quantitative Data
- Quantitative and Qualitative Data
- Quantitative and Qualitative Methods
- Research Procedures
- Serial Position Effect
- Short-term Retention
- Structures of Memory
- Tables, Charts and Graphs
- The Effects of Learning on Development
- The Gilchrist And Nesberg Study Of Motivation
- Three Mountains Task
- Types of Variable
- Types of bias and how to control
- Visual Cues and Constancies
- Visual illusions
- Willingham's Learning Theory
- Cognition and Development
- Cognitive Psychology
- Data Handling and Analysis
- Developmental Psychology
- Eating Behaviour
- Emotion and Motivation
- Famous Psychologists
- Forensic Psychology
- Health Psychology
- Individual Differences Psychology
- Issues and Debates in Psychology
- Personality in Psychology
- Psychological Treatment
- Relationships
- Research Methods in Psychology
- Schizophrenia
- Scientific Foundations of Psychology
- Scientific Investigation
- Sensation and Perception
- Social Context of Behaviour
- Social Psychology
- First, we will discuss the importance of hypotheses in research.
- We will then cover formulating hypotheses in research, including the steps in the formulation of hypotheses in research methodology.
- We will provide examples of hypotheses in research throughout the explanation.
- Finally, we will delve into the different types of hypotheses in research.
What is a Hypothesis?
The current community of psychologists believe that the best approach to understanding behaviour is to conduct scientific research . To be classed as scientific research , it must be observable, valid, reliable and follow a standardised procedure.
One of the important steps in scientific research is to formulate a hypothesis before starting the study procedure.
The hypothesis is a predictive, testable statement predicting the outcome and the results the researcher expects to find.
The hypothesis provides a summary of what direction, if any, is taken to investigate a theory.
In scientific research, there is a criterion that hypotheses need to be met to be regarded as acceptable.
If a hypothesis is disregarded, the research may be rejected by the community of psychology researchers.
Importance of Hypothesis in Research
The purpose of including hypotheses in psychology research is:
- To provide a summary of the research, how it will be investigated, and what is expected to be found.
- To provide an answer to the research question.
When carrying out research, researchers first investigate the research area they are interested in. From this, researchers are required to identify a gap in the literature.
Filling the gap essentially means finding what previous work has not been explained yet, investigated to a sufficient degree, or simply expanding or further investigating a theory if doubt exists.
The researcher then forms a research question that the researcher will attempt to answer in their study.
Remember, the hypothesis is a predictive statement of what is expected to happen when testing the research question.
The hypothesis can be used for later data analysis. This includes inferential tests such as hypothesis testing and identifying if statistical findings are significant.

Steps in the Formulation of Hypothesis in Research Methodology
Researchers must follow certain steps to formulate testable hypotheses when conducting research.
Overall, the researcher has to consider the direction of the research, i.e. will it be looking for a difference caused by independent variables ? Or will it be more concerned with the correlation between variables?
All researchers will likely complete the following.
- Investigating background research in the area of interest.
- Formulating or investigating a theory.
- Identify how the theory will be tested and what the researcher expects to find based on relevant, previously published scientific works.
The above steps are used to formulate testable hypotheses.
The Formulation of Testable Hypotheses
The hypothesis is important in research as it indicates what and how a variable will be investigated.
The hypothesis essentially summarises what and how something will be investigated. This is important as it ensures that the researcher has carefully planned how the research will be done, as the researchers have to follow a set procedure to conduct research.
This is known as the scientific method.
Formulating Hypotheses in Research
When formulating hypotheses, things that researchers should consider are:
| Hypothesis Requirement | Description |
| It should be written as predictive statements regarding the relationship between the IV and DV. | The researcher should be able to predict what they expect to find from the study results. The researcher could state that they expect to see a difference. Occasionally, researchers may theorise what changes are expected to be observed (two-tailed alternative hypothesis). |
| It should be formulated based on background research. | Hypotheses should not be based on guesswork. Instead, researchers should use previously published research to predict the study's expected outcome. |
| Identify the IV. | IV is what the experimenter manipulates to see if it affects the DV. |
| Identify the DV. | DV is the variable being measured after the IV has been manipulated or after it changes during the experiment. |
| The should be operationalised. | The researchers must define how each variable (IV and DV) will be measured. For example, may be measured using a performance test, such as the Mini-Mental Status Examination. When a hypothesis is operationalised, it is testable. |
| The hypotheses need to be falsifiable. | Other researchers need to be able to replicate the research using the same variables to see whether they can verify the results. The hypothesis needs to be written in a way that is falsifiable, meaning it can be tested using the scientific method to see if it is true.An example of a non-falsifiable hypothesis is "leprechauns always find the pot of gold at the end of the rainbow." |
| The hypotheses should be clear. | Hypotheses are usually only a sentence long and should only include the details summarised above. A good hypothesis should not include irrelevant information. |
Types of Hypotheses in Research
Researchers can propose different types of hypotheses when carrying out research.
The following research scenario will be discussed to show examples of each type of hypothesis that the researchers could use. "A research team was investigating whether memory performance is affected by depression ."
The identified independent variable is the severity of depression scores, and the dependent variable is the scores from a memory performance task.
The null hypothesis predicts that the results will show no or little effect. The null hypothesis is a predictive statement that researchers use when it is thought that the IV will not influence the DV.
In this case, the null hypothesis would be there will be no difference in memory scores on the MMSE test of those who are diagnosed with depression and those who are not.
An alternative hypothesis is a predictive statement used when it is thought that the IV will influence the DV. The alternative hypothesis is also called a non-directional, two-tailed hypothesis, as it predicts the results can go either way, e.g. increase or decrease.
The example in this scenario is there will be an observed difference in scores from a memory performance task between people with high- or low-depressive scores.
The directional alternative hypothesis states how the IV will influence the DV, identifying a specific direction, such as if there will be an increase or decrease in the observed results.
The example in this scenario is people with low depressive scores will perform better in the memory performance task than people who score higher in depressive symptoms.
Example Hypothesis in Research
To summarise, let's look at an example of a straightforward hypothesis that indicates the relationship between two variables: the independent and the dependent.
If you stay up late, you will feel tired the following day; the more caffeine you drink, the harder you find it to fall asleep, or the more sunlight plants get, the taller they will grow.
Formulation of Hypothesis - Key Takeaways
- The current community of psychologists believe that the best approach to understanding behaviour is to conduct scientific research. One of the important steps in scientific research is to create a hypothesis.
- The hypothesis is a predictive, testable statement concerning the outcome/results that the researcher expects to find.
- Hypotheses are needed in research to provide a summary of what the research is, how to investigate a theory and what is expected to be found, and to provide an answer to the research question so that the hypothesis can be used for later data analysis.
- There are requirements for the formulation of testable hypotheses. The hypotheses should identify and operationalise the IV and DV. In addition, they should describe the nature of the relationship between the IV and DV.
- There are different types of hypotheses: Null hypothesis, Alternative hypothesis (this is also known as the non-directional, two-tailed hypothesis), and Directional hypothesis (this is also known as the one-tailed hypothesis).
Flashcards in Formulation of Hypothesis 9
Directional, alternative hypothesis
Alternative hypothesis
Null hypothesis

Learn with 9 Formulation of Hypothesis flashcards in the free Vaia app
We have 14,000 flashcards about Dynamic Landscapes.
Already have an account? Log in
Frequently Asked Questions about Formulation of Hypothesis
What are the 3 types of hypotheses?
The three types of hypotheses are:
- Null hypothesis
- Alternative hypothesis
- Directional/non-directional hypothesis
What is an example of a hypothesis in psychology?
An example of a null hypothesis in psychology is, there will be no observed difference in scores from a memory performance task between people with high- or low-depressive scores.
What are the steps in formulating a hypothesis?
All researchers will likely complete the following
- Investigating background research in the area of interest
- Formulating or investigating a theory
- Identify how the theory will be tested and what the researcher expects to find based on relevant, previously published scientific works
What is formulation of hypothesis in research?
The formulation of a hypothesis in research is when the researcher formulates a predictive statement of what is expected to happen when testing the research question based on background research.
How to formulate null and alternative hypothesis?
When formulating a null hypothesis the researcher would state a prediction that they expect to see no difference in the dependent variable when the independent variable changes or is manipulated. Whereas, when using an alternative hypothesis then it would be predicted that there will be a change in the dependent variable. The researcher can state in which direction they expect the results to go.
Test your knowledge with multiple choice flashcards

Join the Vaia App and learn efficiently with millions of flashcards and more!
Keep learning, you are doing great.
Discover learning materials with the free Vaia app

Vaia is a globally recognized educational technology company, offering a holistic learning platform designed for students of all ages and educational levels. Our platform provides learning support for a wide range of subjects, including STEM, Social Sciences, and Languages and also helps students to successfully master various tests and exams worldwide, such as GCSE, A Level, SAT, ACT, Abitur, and more. We offer an extensive library of learning materials, including interactive flashcards, comprehensive textbook solutions, and detailed explanations. The cutting-edge technology and tools we provide help students create their own learning materials. StudySmarter’s content is not only expert-verified but also regularly updated to ensure accuracy and relevance.
Vaia Editorial Team
Team Psychology Teachers
- 8 minutes reading time
- Checked by Vaia Editorial Team
Study anywhere. Anytime.Across all devices.
Create a free account to save this explanation..
Save explanations to your personalised space and access them anytime, anywhere!
By signing up, you agree to the Terms and Conditions and the Privacy Policy of Vaia.
Sign up to highlight and take notes. It’s 100% free.
Join over 22 million students in learning with our Vaia App
The first learning app that truly has everything you need to ace your exams in one place
- Flashcards & Quizzes
- AI Study Assistant
- Study Planner
- Smart Note-Taking

Privacy Overview
Have a language expert improve your writing
Run a free plagiarism check in 10 minutes, generate accurate citations for free.
- Knowledge Base
Hypothesis Testing | A Step-by-Step Guide with Easy Examples
Published on November 8, 2019 by Rebecca Bevans . Revised on June 22, 2023.
Hypothesis testing is a formal procedure for investigating our ideas about the world using statistics . It is most often used by scientists to test specific predictions, called hypotheses, that arise from theories.
There are 5 main steps in hypothesis testing:
- State your research hypothesis as a null hypothesis and alternate hypothesis (H o ) and (H a or H 1 ).
- Collect data in a way designed to test the hypothesis.
- Perform an appropriate statistical test .
- Decide whether to reject or fail to reject your null hypothesis.
- Present the findings in your results and discussion section.
Though the specific details might vary, the procedure you will use when testing a hypothesis will always follow some version of these steps.
Table of contents
Step 1: state your null and alternate hypothesis, step 2: collect data, step 3: perform a statistical test, step 4: decide whether to reject or fail to reject your null hypothesis, step 5: present your findings, other interesting articles, frequently asked questions about hypothesis testing.
After developing your initial research hypothesis (the prediction that you want to investigate), it is important to restate it as a null (H o ) and alternate (H a ) hypothesis so that you can test it mathematically.
The alternate hypothesis is usually your initial hypothesis that predicts a relationship between variables. The null hypothesis is a prediction of no relationship between the variables you are interested in.
- H 0 : Men are, on average, not taller than women. H a : Men are, on average, taller than women.
Prevent plagiarism. Run a free check.
For a statistical test to be valid , it is important to perform sampling and collect data in a way that is designed to test your hypothesis. If your data are not representative, then you cannot make statistical inferences about the population you are interested in.
There are a variety of statistical tests available, but they are all based on the comparison of within-group variance (how spread out the data is within a category) versus between-group variance (how different the categories are from one another).
If the between-group variance is large enough that there is little or no overlap between groups, then your statistical test will reflect that by showing a low p -value . This means it is unlikely that the differences between these groups came about by chance.
Alternatively, if there is high within-group variance and low between-group variance, then your statistical test will reflect that with a high p -value. This means it is likely that any difference you measure between groups is due to chance.
Your choice of statistical test will be based on the type of variables and the level of measurement of your collected data .
- an estimate of the difference in average height between the two groups.
- a p -value showing how likely you are to see this difference if the null hypothesis of no difference is true.
Based on the outcome of your statistical test, you will have to decide whether to reject or fail to reject your null hypothesis.
In most cases you will use the p -value generated by your statistical test to guide your decision. And in most cases, your predetermined level of significance for rejecting the null hypothesis will be 0.05 – that is, when there is a less than 5% chance that you would see these results if the null hypothesis were true.
In some cases, researchers choose a more conservative level of significance, such as 0.01 (1%). This minimizes the risk of incorrectly rejecting the null hypothesis ( Type I error ).
Here's why students love Scribbr's proofreading services
Discover proofreading & editing
The results of hypothesis testing will be presented in the results and discussion sections of your research paper , dissertation or thesis .
In the results section you should give a brief summary of the data and a summary of the results of your statistical test (for example, the estimated difference between group means and associated p -value). In the discussion , you can discuss whether your initial hypothesis was supported by your results or not.
In the formal language of hypothesis testing, we talk about rejecting or failing to reject the null hypothesis. You will probably be asked to do this in your statistics assignments.
However, when presenting research results in academic papers we rarely talk this way. Instead, we go back to our alternate hypothesis (in this case, the hypothesis that men are on average taller than women) and state whether the result of our test did or did not support the alternate hypothesis.
If your null hypothesis was rejected, this result is interpreted as “supported the alternate hypothesis.”
These are superficial differences; you can see that they mean the same thing.
You might notice that we don’t say that we reject or fail to reject the alternate hypothesis . This is because hypothesis testing is not designed to prove or disprove anything. It is only designed to test whether a pattern we measure could have arisen spuriously, or by chance.
If we reject the null hypothesis based on our research (i.e., we find that it is unlikely that the pattern arose by chance), then we can say our test lends support to our hypothesis . But if the pattern does not pass our decision rule, meaning that it could have arisen by chance, then we say the test is inconsistent with our hypothesis .
If you want to know more about statistics , methodology , or research bias , make sure to check out some of our other articles with explanations and examples.
- Normal distribution
- Descriptive statistics
- Measures of central tendency
- Correlation coefficient
Methodology
- Cluster sampling
- Stratified sampling
- Types of interviews
- Cohort study
- Thematic analysis
Research bias
- Implicit bias
- Cognitive bias
- Survivorship bias
- Availability heuristic
- Nonresponse bias
- Regression to the mean
Hypothesis testing is a formal procedure for investigating our ideas about the world using statistics. It is used by scientists to test specific predictions, called hypotheses , by calculating how likely it is that a pattern or relationship between variables could have arisen by chance.
A hypothesis states your predictions about what your research will find. It is a tentative answer to your research question that has not yet been tested. For some research projects, you might have to write several hypotheses that address different aspects of your research question.
A hypothesis is not just a guess — it should be based on existing theories and knowledge. It also has to be testable, which means you can support or refute it through scientific research methods (such as experiments, observations and statistical analysis of data).
Null and alternative hypotheses are used in statistical hypothesis testing . The null hypothesis of a test always predicts no effect or no relationship between variables, while the alternative hypothesis states your research prediction of an effect or relationship.
Cite this Scribbr article
If you want to cite this source, you can copy and paste the citation or click the “Cite this Scribbr article” button to automatically add the citation to our free Citation Generator.
Bevans, R. (2023, June 22). Hypothesis Testing | A Step-by-Step Guide with Easy Examples. Scribbr. Retrieved September 8, 2024, from https://www.scribbr.com/statistics/hypothesis-testing/
Is this article helpful?

Rebecca Bevans
Other students also liked, choosing the right statistical test | types & examples, understanding p values | definition and examples, what is your plagiarism score.
Want to create or adapt books like this? Learn more about how Pressbooks supports open publishing practices.
Developing a Hypothesis
Rajiv S. Jhangiani; I-Chant A. Chiang; Carrie Cuttler; and Dana C. Leighton
Learning Objectives
- Distinguish between a theory and a hypothesis.
- Discover how theories are used to generate hypotheses and how the results of studies can be used to further inform theories.
- Understand the characteristics of a good hypothesis.
Theories and Hypotheses
Before describing how to develop a hypothesis, it is important to distinguish between a theory and a hypothesis. A theory is a coherent explanation or interpretation of one or more phenomena. Although theories can take a variety of forms, one thing they have in common is that they go beyond the phenomena they explain by including variables, structures, processes, functions, or organizing principles that have not been observed directly. Consider, for example, Zajonc’s theory of social facilitation and social inhibition (1965) [1] . He proposed that being watched by others while performing a task creates a general state of physiological arousal, which increases the likelihood of the dominant (most likely) response. So for highly practiced tasks, being watched increases the tendency to make correct responses, but for relatively unpracticed tasks, being watched increases the tendency to make incorrect responses. Notice that this theory—which has come to be called drive theory—provides an explanation of both social facilitation and social inhibition that goes beyond the phenomena themselves by including concepts such as “arousal” and “dominant response,” along with processes such as the effect of arousal on the dominant response.
Outside of science, referring to an idea as a theory often implies that it is untested—perhaps no more than a wild guess. In science, however, the term theory has no such implication. A theory is simply an explanation or interpretation of a set of phenomena. It can be untested, but it can also be extensively tested, well supported, and accepted as an accurate description of the world by the scientific community. The theory of evolution by natural selection, for example, is a theory because it is an explanation of the diversity of life on earth—not because it is untested or unsupported by scientific research. On the contrary, the evidence for this theory is overwhelmingly positive and nearly all scientists accept its basic assumptions as accurate. Similarly, the “germ theory” of disease is a theory because it is an explanation of the origin of various diseases, not because there is any doubt that many diseases are caused by microorganisms that infect the body.
A hypothesis , on the other hand, is a specific prediction about a new phenomenon that should be observed if a particular theory is accurate. It is an explanation that relies on just a few key concepts. Hypotheses are often specific predictions about what will happen in a particular study. They are developed by considering existing evidence and using reasoning to infer what will happen in the specific context of interest. Hypotheses are often but not always derived from theories. So a hypothesis is often a prediction based on a theory but some hypotheses are a-theoretical and only after a set of observations have been made, is a theory developed. This is because theories are broad in nature and they explain larger bodies of data. So if our research question is really original then we may need to collect some data and make some observations before we can develop a broader theory.
Theories and hypotheses always have this if-then relationship. “ If drive theory is correct, then cockroaches should run through a straight runway faster, and a branching runway more slowly, when other cockroaches are present.” Although hypotheses are usually expressed as statements, they can always be rephrased as questions. “Do cockroaches run through a straight runway faster when other cockroaches are present?” Thus deriving hypotheses from theories is an excellent way of generating interesting research questions.
But how do researchers derive hypotheses from theories? One way is to generate a research question using the techniques discussed in this chapter and then ask whether any theory implies an answer to that question. For example, you might wonder whether expressive writing about positive experiences improves health as much as expressive writing about traumatic experiences. Although this question is an interesting one on its own, you might then ask whether the habituation theory—the idea that expressive writing causes people to habituate to negative thoughts and feelings—implies an answer. In this case, it seems clear that if the habituation theory is correct, then expressive writing about positive experiences should not be effective because it would not cause people to habituate to negative thoughts and feelings. A second way to derive hypotheses from theories is to focus on some component of the theory that has not yet been directly observed. For example, a researcher could focus on the process of habituation—perhaps hypothesizing that people should show fewer signs of emotional distress with each new writing session.
Among the very best hypotheses are those that distinguish between competing theories. For example, Norbert Schwarz and his colleagues considered two theories of how people make judgments about themselves, such as how assertive they are (Schwarz et al., 1991) [2] . Both theories held that such judgments are based on relevant examples that people bring to mind. However, one theory was that people base their judgments on the number of examples they bring to mind and the other was that people base their judgments on how easily they bring those examples to mind. To test these theories, the researchers asked people to recall either six times when they were assertive (which is easy for most people) or 12 times (which is difficult for most people). Then they asked them to judge their own assertiveness. Note that the number-of-examples theory implies that people who recalled 12 examples should judge themselves to be more assertive because they recalled more examples, but the ease-of-examples theory implies that participants who recalled six examples should judge themselves as more assertive because recalling the examples was easier. Thus the two theories made opposite predictions so that only one of the predictions could be confirmed. The surprising result was that participants who recalled fewer examples judged themselves to be more assertive—providing particularly convincing evidence in favor of the ease-of-retrieval theory over the number-of-examples theory.
Theory Testing
The primary way that scientific researchers use theories is sometimes called the hypothetico-deductive method (although this term is much more likely to be used by philosophers of science than by scientists themselves). Researchers begin with a set of phenomena and either construct a theory to explain or interpret them or choose an existing theory to work with. They then make a prediction about some new phenomenon that should be observed if the theory is correct. Again, this prediction is called a hypothesis. The researchers then conduct an empirical study to test the hypothesis. Finally, they reevaluate the theory in light of the new results and revise it if necessary. This process is usually conceptualized as a cycle because the researchers can then derive a new hypothesis from the revised theory, conduct a new empirical study to test the hypothesis, and so on. As Figure 2.3 shows, this approach meshes nicely with the model of scientific research in psychology presented earlier in the textbook—creating a more detailed model of “theoretically motivated” or “theory-driven” research.
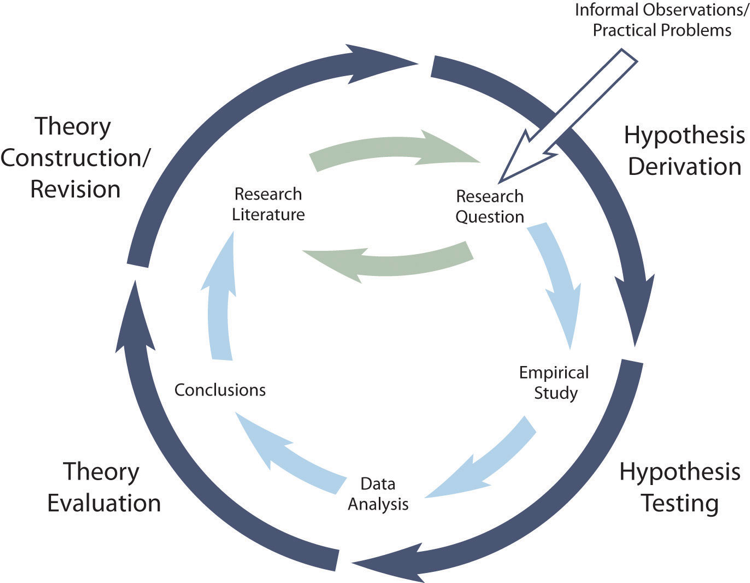
As an example, let us consider Zajonc’s research on social facilitation and inhibition. He started with a somewhat contradictory pattern of results from the research literature. He then constructed his drive theory, according to which being watched by others while performing a task causes physiological arousal, which increases an organism’s tendency to make the dominant response. This theory predicts social facilitation for well-learned tasks and social inhibition for poorly learned tasks. He now had a theory that organized previous results in a meaningful way—but he still needed to test it. He hypothesized that if his theory was correct, he should observe that the presence of others improves performance in a simple laboratory task but inhibits performance in a difficult version of the very same laboratory task. To test this hypothesis, one of the studies he conducted used cockroaches as subjects (Zajonc, Heingartner, & Herman, 1969) [3] . The cockroaches ran either down a straight runway (an easy task for a cockroach) or through a cross-shaped maze (a difficult task for a cockroach) to escape into a dark chamber when a light was shined on them. They did this either while alone or in the presence of other cockroaches in clear plastic “audience boxes.” Zajonc found that cockroaches in the straight runway reached their goal more quickly in the presence of other cockroaches, but cockroaches in the cross-shaped maze reached their goal more slowly when they were in the presence of other cockroaches. Thus he confirmed his hypothesis and provided support for his drive theory. (Zajonc also showed that drive theory existed in humans [Zajonc & Sales, 1966] [4] in many other studies afterward).
Incorporating Theory into Your Research
When you write your research report or plan your presentation, be aware that there are two basic ways that researchers usually include theory. The first is to raise a research question, answer that question by conducting a new study, and then offer one or more theories (usually more) to explain or interpret the results. This format works well for applied research questions and for research questions that existing theories do not address. The second way is to describe one or more existing theories, derive a hypothesis from one of those theories, test the hypothesis in a new study, and finally reevaluate the theory. This format works well when there is an existing theory that addresses the research question—especially if the resulting hypothesis is surprising or conflicts with a hypothesis derived from a different theory.
To use theories in your research will not only give you guidance in coming up with experiment ideas and possible projects, but it lends legitimacy to your work. Psychologists have been interested in a variety of human behaviors and have developed many theories along the way. Using established theories will help you break new ground as a researcher, not limit you from developing your own ideas.
Characteristics of a Good Hypothesis
There are three general characteristics of a good hypothesis. First, a good hypothesis must be testable and falsifiable . We must be able to test the hypothesis using the methods of science and if you’ll recall Popper’s falsifiability criterion, it must be possible to gather evidence that will disconfirm the hypothesis if it is indeed false. Second, a good hypothesis must be logical. As described above, hypotheses are more than just a random guess. Hypotheses should be informed by previous theories or observations and logical reasoning. Typically, we begin with a broad and general theory and use deductive reasoning to generate a more specific hypothesis to test based on that theory. Occasionally, however, when there is no theory to inform our hypothesis, we use inductive reasoning which involves using specific observations or research findings to form a more general hypothesis. Finally, the hypothesis should be positive. That is, the hypothesis should make a positive statement about the existence of a relationship or effect, rather than a statement that a relationship or effect does not exist. As scientists, we don’t set out to show that relationships do not exist or that effects do not occur so our hypotheses should not be worded in a way to suggest that an effect or relationship does not exist. The nature of science is to assume that something does not exist and then seek to find evidence to prove this wrong, to show that it really does exist. That may seem backward to you but that is the nature of the scientific method. The underlying reason for this is beyond the scope of this chapter but it has to do with statistical theory.
- Zajonc, R. B. (1965). Social facilitation. Science, 149 , 269–274 ↵
- Schwarz, N., Bless, H., Strack, F., Klumpp, G., Rittenauer-Schatka, H., & Simons, A. (1991). Ease of retrieval as information: Another look at the availability heuristic. Journal of Personality and Social Psychology, 61 , 195–202. ↵
- Zajonc, R. B., Heingartner, A., & Herman, E. M. (1969). Social enhancement and impairment of performance in the cockroach. Journal of Personality and Social Psychology, 13 , 83–92. ↵
- Zajonc, R.B. & Sales, S.M. (1966). Social facilitation of dominant and subordinate responses. Journal of Experimental Social Psychology, 2 , 160-168. ↵
A coherent explanation or interpretation of one or more phenomena.
A specific prediction about a new phenomenon that should be observed if a particular theory is accurate.
A cyclical process of theory development, starting with an observed phenomenon, then developing or using a theory to make a specific prediction of what should happen if that theory is correct, testing that prediction, refining the theory in light of the findings, and using that refined theory to develop new hypotheses, and so on.
The ability to test the hypothesis using the methods of science and the possibility to gather evidence that will disconfirm the hypothesis if it is indeed false.
Developing a Hypothesis Copyright © by Rajiv S. Jhangiani; I-Chant A. Chiang; Carrie Cuttler; and Dana C. Leighton is licensed under a Creative Commons Attribution-NonCommercial-ShareAlike 4.0 International License , except where otherwise noted.
Share This Book
Hypothesis: Functions, Problems, Types, Characteristics, Examples
Basic Elements of the Scientific Method: Hypotheses
The Function of the Hypotheses
A hypothesis states what one is looking for in an experiment. When facts are assembled, ordered, and seen in a relationship, they build up to become a theory. This theory needs to be deduced for further confirmation of the facts, this formulation of the deductions constitutes of a hypothesis. As a theory states a logical relationship between facts and from this, the propositions which are deduced should be true. Hence, these deduced prepositions are called hypotheses.
Problems in Formulating the Hypothesis
There are three major difficulties in the formulation of a hypothesis, they are as follows:
Sometimes the deduction of a hypothesis may be difficult as there would be many variables and the necessity to take them all into consideration becomes a challenge. For instance, observing two cases:
Deduction: This situation holds much more sense to the people who are in professions such as psychotherapy, psychiatry and law to some extent. They possess a very intimate relationship with their clients, thus are more susceptible to issues regarding emotional strains in the client-practitioner relationship and more implicit and explicit controls over both participants in comparison to other professions.
2. Principle: Extensive but relatively systematized data show the correlation between members of the upper occupational class and less unhappiness and worry. Also, they are subjected to more formal controls than members of the lower strata.
Deduction: There can numerous ways to approach this principle, one could go with the comparison applying to martial relationships of the members and further argue that such differential pressures could be observed through divorce rates. This hypothesis would show inverse correlations between class position and divorce rates. There would be a very strong need to define the terms carefully to show the deduction from the principle problem.
Types of Hypothesis
Science and hypothesis.
“The general culture in which a science develops furnishes many of its basic hypotheses” holds true as science has developed more in the West and is no accident that it is a function of culture itself. This is quite evident with the culture of the West as they read for morals, science and happiness. After the examination of a bunch of variables, it is quite easy to say that the cultural emphasis upon happiness has been productive of an almost limitless range.
The hypotheses originate from science; a key example in the form of “socialization” may be taken. The socialization process in learning science involves a feedback mechanism between the scientist and the student. The student learns from the scientist and then tests for results with his own experience, and the scientist in turn has to do the same with his colleagues.
Analogies are a source of useful hypotheses but not without its dangers as all variables may not be accounted for it as no civilization has a perfect system.
Hypotheses are also the consequence of personal, idiosyncratic experience as the manner in which the individual reacts to the hypotheses is also important and should be accounted for in the experiment.
The Characteristics for Usable Hypotheses
The formulation of a hypothesis is probably the most necessary step in good research practice and it is very essential to get the thought process started. It helps the researcher to have a specific goal in mind and deduce the end result of an experiment with ease and efficiency. History is evident that asking the right questions always works out fine.
Also Read: Research Methods – Basics
Kartik is studying BA in International Relations at Amity and Dropped out of engineering from NIT Hamirpur and he lived in over 5 different countries.
What is Hypothesis? Definition, Meaning, Characteristics, Sources
- Post last modified: 10 January 2022
- Reading time: 18 mins read
- Post category: Research Methodology

What is Hypothesis?
Hypothesis is a prediction of the outcome of a study. Hypotheses are drawn from theories and research questions or from direct observations. In fact, a research problem can be formulated as a hypothesis. To test the hypothesis we need to formulate it in terms that can actually be analysed with statistical tools.
As an example, if we want to explore whether using a specific teaching method at school will result in better school marks (research question), the hypothesis could be that the mean school marks of students being taught with that specific teaching method will be higher than of those being taught using other methods.
In this example, we stated a hypothesis about the expected differences between groups. Other hypotheses may refer to correlations between variables.
Table of Content
- 1 What is Hypothesis?
- 2 Hypothesis Definition
- 3 Meaning of Hypothesis
- 4.1 Conceptual Clarity
- 4.2 Need of empirical referents
- 4.3 Hypothesis should be specific
- 4.4 Hypothesis should be within the ambit of the available research techniques
- 4.5 Hypothesis should be consistent with the theory
- 4.6 Hypothesis should be concerned with observable facts and empirical events
- 4.7 Hypothesis should be simple
- 5.1 Observation
- 5.2 Analogies
- 5.4 State of Knowledge
- 5.5 Culture
- 5.6 Continuity of Research
- 6.1 Null Hypothesis
- 6.2 Alternative Hypothesis
Thus, to formulate a hypothesis, we need to refer to the descriptive statistics (such as the mean final marks), and specify a set of conditions about these statistics (such as a difference between the means, or in a different example, a positive or negative correlation). The hypothesis we formulate applies to the population of interest.
The null hypothesis makes a statement that no difference exists (see Pyrczak, 1995, pp. 75-84).
Hypothesis Definition
A hypothesis is ‘a guess or supposition as to the existence of some fact or law which will serve to explain a connection of facts already known to exist.’ – J. E. Creighton & H. R. Smart
Hypothesis is ‘a proposition not known to be definitely true or false, examined for the sake of determining the consequences which would follow from its truth.’ – Max Black
Hypothesis is ‘a proposition which can be put to a test to determine validity and is useful for further research.’ – W. J. Goode and P. K. Hatt
A hypothesis is a proposition, condition or principle which is assumed, perhaps without belief, in order to draw out its logical consequences and by this method to test its accord with facts which are known or may be determined. – Webster’s New International Dictionary of the English Language (1956)
Meaning of Hypothesis
From the above mentioned definitions of hypothesis, its meaning can be explained in the following ways.
- At the primary level, a hypothesis is the possible and probable explanation of the sequence of happenings or data.
- Sometimes, hypothesis may emerge from an imagination, common sense or a sudden event.
- Hypothesis can be a probable answer to the research problem undertaken for study. 4. Hypothesis may not always be true. It can get disproven. In other words, hypothesis need not always be a true proposition.
- Hypothesis, in a sense, is an attempt to present the interrelations that exist in the available data or information.
- Hypothesis is not an individual opinion or community thought. Instead, it is a philosophical means which is to be used for research purpose. Hypothesis is not to be considered as the ultimate objective; rather it is to be taken as the means of explaining scientifically the prevailing situation.
The concept of hypothesis can further be explained with the help of some examples. Lord Keynes, in his theory of national income determination, made a hypothesis about the consumption function. He stated that the consumption expenditure of an individual or an economy as a whole is dependent on the level of income and changes in a certain proportion.
Later, this proposition was proved in the statistical research carried out by Prof. Simon Kuznets. Matthus, while studying the population, formulated a hypothesis that population increases faster than the supply of food grains. Population studies of several countries revealed that this hypothesis is true.
Validation of the Malthus’ hypothesis turned it into a theory and when it was tested in many other countries it became the famous Malthus’ Law of Population. It thus emerges that when a hypothesis is tested and proven, it becomes a theory. The theory, when found true in different times and at different places, becomes the law. Having understood the concept of hypothesis, few hypotheses can be formulated in the areas of commerce and economics.
- Population growth moderates with the rise in per capita income.
- Sales growth is positively linked with the availability of credit.
- Commerce education increases the employability of the graduate students.
- High rates of direct taxes prompt people to evade taxes.
- Good working conditions improve the productivity of employees.
- Advertising is the most effecting way of promoting sales than any other scheme.
- Higher Debt-Equity Ratio increases the probability of insolvency.
- Economic reforms in India have made the public sector banks more efficient and competent.
- Foreign direct investment in India has moved in those sectors which offer higher rate of profit.
- There is no significant association between credit rating and investment of fund.
Characteristics of Hypothesis
Not all the hypotheses are good and useful from the point of view of research. It is only a few hypotheses satisfying certain criteria that are good, useful and directive in the research work undertaken. The characteristics of such a useful hypothesis can be listed as below:
Conceptual Clarity
Need of empirical referents, hypothesis should be specific, hypothesis should be within the ambit of the available research techniques, hypothesis should be consistent with the theory, hypothesis should be concerned with observable facts and empirical events, hypothesis should be simple.
The concepts used while framing hypothesis should be crystal clear and unambiguous. Such concepts must be clearly defined so that they become lucid and acceptable to everyone. How are the newly developed concepts interrelated and how are they linked with the old one is to be very clear so that the hypothesis framed on their basis also carries the same clarity.
A hypothesis embodying unclear and ambiguous concepts can to a great extent undermine the successful completion of the research work.
A hypothesis can be useful in the research work undertaken only when it has links with some empirical referents. Hypothesis based on moral values and ideals are useless as they cannot be tested. Similarly, hypothesis containing opinions as good and bad or expectation with respect to something are not testable and therefore useless.
For example, ‘current account deficit can be lowered if people change their attitude towards gold’ is a hypothesis encompassing expectation. In case of such a hypothesis, the attitude towards gold is something which cannot clearly be described and therefore a hypothesis which embodies such an unclean thing cannot be tested and proved or disproved. In short, the hypothesis should be linked with some testable referents.
For the successful conduction of research, it is necessary that the hypothesis is specific and presented in a precise manner. Hypothesis which is general, too ambitious and grandiose in scope is not to be made as such hypothesis cannot be easily put to test. A hypothesis is to be based on such concepts which are precise and empirical in nature. A hypothesis should give a clear idea about the indicators which are to be used.
For example, a hypothesis that economic power is increasingly getting concentrated in a few hands in India should enable us to define the concept of economic power. It should be explicated in terms of measurable indicator like income, wealth, etc. Such specificity in the formulation of a hypothesis ensures that the research is practicable and significant.
While framing the hypothesis, the researcher should be aware of the available research techniques and should see that the hypothesis framed is testable on the basis of them. In other words, a hypothesis should be researchable and for this it is important that a due thought has been given to the methods and techniques which can be used to measure the concepts and variables embodied in the hypothesis.
It does not however mean that hypotheses which are not testable with the available techniques of research are not to be made. If the problem is too significant and therefore the hypothesis framed becomes too ambitious and complex, it’s testing becomes possible with the development of new research techniques or the hypothesis itself leads to the development of new research techniques.
A hypothesis must be related to the existing theory or should have a theoretical orientation. The growth of knowledge takes place in the sequence of facts, hypothesis, theory and law or principles. It means the hypothesis should have a correspondence with the existing facts and theory.
If the hypothesis is related to some theory, the research work will enable us to support, modify or refute the existing theory. Theoretical orientation of the hypothesis ensures that it becomes scientifically useful. According to Prof. Goode and Prof. Hatt, research work can contribute to the existing knowledge only when the hypothesis is related with some theory.
This enables us to explain the observed facts and situations and also verify the framed hypothesis. In the words of Prof. Cohen and Prof. Nagel, “hypothesis must be formulated in such a manner that deduction can be made from it and that consequently a decision can be reached as to whether it does or does not explain the facts considered.”
If the research work based on a hypothesis is to be successful, it is necessary that the later is as simple and easy as possible. An ambition of finding out something new may lead the researcher to frame an unrealistic and unclear hypothesis. Such a temptation is to be avoided. Framing a simple, easy and testable hypothesis requires that the researcher is well acquainted with the related concepts.
Sources of Hypothesis
Hypotheses can be derived from various sources. Some of the sources is given below:
Observation
State of knowledge, continuity of research.
Hypotheses can be derived from observation from the observation of price behavior in a market. For example the relationship between the price and demand for an article is hypothesized.
Analogies are another source of useful hypotheses. Julian Huxley has pointed out that casual observations in nature or in the framework of another science may be a fertile source of hypotheses. For example, the hypotheses that similar human types or activities may be found in similar geophysical regions come from plant ecology.
This is one of the main sources of hypotheses. It gives direction to research by stating what is known logical deduction from theory lead to new hypotheses. For example, profit / wealth maximization is considered as the goal of private enterprises. From this assumption various hypotheses are derived’.
An important source of hypotheses is the state of knowledge in any particular science where formal theories exist hypotheses can be deduced. If the hypotheses are rejected theories are scarce hypotheses are generated from conception frameworks.
Another source of hypotheses is the culture on which the researcher was nurtured. Western culture has induced the emergence of sociology as an academic discipline over the past decade, a large part of the hypotheses on American society examined by researchers were connected with violence. This interest is related to the considerable increase in the level of violence in America.
The continuity of research in a field itself constitutes an important source of hypotheses. The rejection of some hypotheses leads to the formulation of new ones capable of explaining dependent variables in subsequent research on the same subject.
Null and Alternative Hypothesis
Null hypothesis.
The hypothesis that are proposed with the intent of receiving a rejection for them are called Null Hypothesis . This requires that we hypothesize the opposite of what is desired to be proved. For example, if we want to show that sales and advertisement expenditure are related, we formulate the null hypothesis that they are not related.
Similarly, if we want to conclude that the new sales training programme is effective, we formulate the null hypothesis that the new training programme is not effective, and if we want to prove that the average wages of skilled workers in town 1 is greater than that of town 2, we formulate the null hypotheses that there is no difference in the average wages of the skilled workers in both the towns.
Since we hypothesize that sales and advertisement are not related, new training programme is not effective and the average wages of skilled workers in both the towns are equal, we call such hypotheses null hypotheses and denote them as H 0 .
Alternative Hypothesis
Rejection of null hypotheses leads to the acceptance of alternative hypothesis . The rejection of null hypothesis indicates that the relationship between variables (e.g., sales and advertisement expenditure) or the difference between means (e.g., wages of skilled workers in town 1 and town 2) or the difference between proportions have statistical significance and the acceptance of the null hypotheses indicates that these differences are due to chance.
As already mentioned, the alternative hypotheses specify that values/relation which the researcher believes hold true. The alternative hypotheses can cover a whole range of values rather than a single point. The alternative hypotheses are denoted by H 1 .
Business Ethics
( Click on Topic to Read )
- What is Ethics?
- What is Business Ethics?
- Values, Norms, Beliefs and Standards in Business Ethics
- Indian Ethos in Management
- Ethical Issues in Marketing
- Ethical Issues in HRM
- Ethical Issues in IT
- Ethical Issues in Production and Operations Management
- Ethical Issues in Finance and Accounting
- What is Corporate Governance?
- What is Ownership Concentration?
- What is Ownership Composition?
- Types of Companies in India
- Internal Corporate Governance
- External Corporate Governance
- Corporate Governance in India
- What is Enterprise Risk Management (ERM)?
- What is Assessment of Risk?
- What is Risk Register?
- Risk Management Committee
Corporate social responsibility (CSR)
- Theories of CSR
- Arguments Against CSR
- Business Case for CSR
- Importance of CSR in India
- Drivers of Corporate Social Responsibility
- Developing a CSR Strategy
- Implement CSR Commitments
- CSR Marketplace
- CSR at Workplace
- Environmental CSR
- CSR with Communities and in Supply Chain
- Community Interventions
- CSR Monitoring
- CSR Reporting
- Voluntary Codes in CSR
- What is Corporate Ethics?
Lean Six Sigma
- What is Six Sigma?
- What is Lean Six Sigma?
- Value and Waste in Lean Six Sigma
- Six Sigma Team
- MAIC Six Sigma
- Six Sigma in Supply Chains
- What is Binomial, Poisson, Normal Distribution?
- What is Sigma Level?
- What is DMAIC in Six Sigma?
- What is DMADV in Six Sigma?
- Six Sigma Project Charter
- Project Decomposition in Six Sigma
- Critical to Quality (CTQ) Six Sigma
- Process Mapping Six Sigma
- Flowchart and SIPOC
- Gage Repeatability and Reproducibility
- Statistical Diagram
- Lean Techniques for Optimisation Flow
- Failure Modes and Effects Analysis (FMEA)
- What is Process Audits?
- Six Sigma Implementation at Ford
- IBM Uses Six Sigma to Drive Behaviour Change
- Research Methodology
- What is Research?
Sampling Method
- Research Methods
Data Collection in Research
- Methods of Collecting Data
- Application of Business Research
- Levels of Measurement
- What is Sampling?
- Hypothesis Testing
- Research Report
- What is Management?
- Planning in Management
- Decision Making in Management
- What is Controlling?
- What is Coordination?
- What is Staffing?
- Organization Structure
- What is Departmentation?
- Span of Control
- What is Authority?
- Centralization vs Decentralization
- Organizing in Management
- Schools of Management Thought
- Classical Management Approach
- Is Management an Art or Science?
- Who is a Manager?
Operations Research
- What is Operations Research?
- Operation Research Models
- Linear Programming
- Linear Programming Graphic Solution
- Linear Programming Simplex Method
- Linear Programming Artificial Variable Technique
- Duality in Linear Programming
- Transportation Problem Initial Basic Feasible Solution
- Transportation Problem Finding Optimal Solution
- Project Network Analysis with Critical Path Method
- Project Network Analysis Methods
- Project Evaluation and Review Technique (PERT)
- Simulation in Operation Research
- Replacement Models in Operation Research
Operation Management
- What is Strategy?
- What is Operations Strategy?
- Operations Competitive Dimensions
- Operations Strategy Formulation Process
- What is Strategic Fit?
- Strategic Design Process
- Focused Operations Strategy
- Corporate Level Strategy
- Expansion Strategies
- Stability Strategies
- Retrenchment Strategies
- Competitive Advantage
- Strategic Choice and Strategic Alternatives
- What is Production Process?
- What is Process Technology?
- What is Process Improvement?
- Strategic Capacity Management
- Production and Logistics Strategy
- Taxonomy of Supply Chain Strategies
- Factors Considered in Supply Chain Planning
- Operational and Strategic Issues in Global Logistics
- Logistics Outsourcing Strategy
- What is Supply Chain Mapping?
- Supply Chain Process Restructuring
- Points of Differentiation
- Re-engineering Improvement in SCM
- What is Supply Chain Drivers?
- Supply Chain Operations Reference (SCOR) Model
- Customer Service and Cost Trade Off
- Internal and External Performance Measures
- Linking Supply Chain and Business Performance
- Netflix’s Niche Focused Strategy
- Disney and Pixar Merger
- Process Planning at Mcdonald’s
Service Operations Management
- What is Service?
- What is Service Operations Management?
- What is Service Design?
- Service Design Process
- Service Delivery
- What is Service Quality?
- Gap Model of Service Quality
- Juran Trilogy
- Service Performance Measurement
- Service Decoupling
- IT Service Operation
- Service Operations Management in Different Sector
Procurement Management
- What is Procurement Management?
- Procurement Negotiation
- Types of Requisition
- RFX in Procurement
- What is Purchasing Cycle?
- Vendor Managed Inventory
- Internal Conflict During Purchasing Operation
- Spend Analysis in Procurement
- Sourcing in Procurement
- Supplier Evaluation and Selection in Procurement
- Blacklisting of Suppliers in Procurement
- Total Cost of Ownership in Procurement
- Incoterms in Procurement
- Documents Used in International Procurement
- Transportation and Logistics Strategy
- What is Capital Equipment?
- Procurement Process of Capital Equipment
- Acquisition of Technology in Procurement
- What is E-Procurement?
- E-marketplace and Online Catalogues
- Fixed Price and Cost Reimbursement Contracts
- Contract Cancellation in Procurement
- Ethics in Procurement
- Legal Aspects of Procurement
- Global Sourcing in Procurement
- Intermediaries and Countertrade in Procurement
Strategic Management
- What is Strategic Management?
- What is Value Chain Analysis?
- Mission Statement
- Business Level Strategy
- What is SWOT Analysis?
- What is Competitive Advantage?
- What is Vision?
- What is Ansoff Matrix?
- Prahalad and Gary Hammel
- Strategic Management In Global Environment
- Competitor Analysis Framework
- Competitive Rivalry Analysis
- Competitive Dynamics
- What is Competitive Rivalry?
- Five Competitive Forces That Shape Strategy
- What is PESTLE Analysis?
- Fragmentation and Consolidation Of Industries
- What is Technology Life Cycle?
- What is Diversification Strategy?
- What is Corporate Restructuring Strategy?
- Resources and Capabilities of Organization
- Role of Leaders In Functional-Level Strategic Management
- Functional Structure In Functional Level Strategy Formulation
- Information And Control System
- What is Strategy Gap Analysis?
- Issues In Strategy Implementation
- Matrix Organizational Structure
- What is Strategic Management Process?
Supply Chain
- What is Supply Chain Management?
- Supply Chain Planning and Measuring Strategy Performance
- What is Warehousing?
- What is Packaging?
- What is Inventory Management?
- What is Material Handling?
- What is Order Picking?
- Receiving and Dispatch, Processes
- What is Warehouse Design?
- What is Warehousing Costs?
You Might Also Like
Data analysis in research, what is research methodology, what is hypothesis testing procedure, what is literature review importance, functions, process,, research process | types, measures of relationship, primary data and secondary data, what is sampling need, advantages, limitations, types of errors affecting research design, leave a reply cancel reply.
You must be logged in to post a comment.
World's Best Online Courses at One Place
We’ve spent the time in finding, so you can spend your time in learning
Digital Marketing
Personal Growth

Development
Step-by-step guide to hypothesis testing in statistics

Hypothesis testing in statistics helps us use data to make informed decisions. It starts with an assumption or guess about a group or population—something we believe might be true. We then collect sample data to check if there is enough evidence to support or reject that guess. This method is useful in many fields, like science, business, and healthcare, where decisions need to be based on facts.
Learning how to do hypothesis testing in statistics step-by-step can help you better understand data and make smarter choices, even when things are uncertain. This guide will take you through each step, from creating your hypothesis to making sense of the results, so you can see how it works in practical situations.
What is Hypothesis Testing?
Table of Contents
Hypothesis testing is a method for determining whether data supports a certain idea or assumption about a larger group. It starts by making a guess, like an average or a proportion, and then uses a small sample of data to see if that guess seems true or not.
For example, if a company wants to know if its new product is more popular than its old one, it can use hypothesis testing. They start with a statement like “The new product is not more popular than the old one” (this is the null hypothesis) and compare it with “The new product is more popular” (this is the alternative hypothesis). Then, they look at customer feedback to see if there’s enough evidence to reject the first statement and support the second one.
Simply put, hypothesis testing is a way to use data to help make decisions and understand what the data is really telling us, even when we don’t have all the answers.
Importance Of Hypothesis Testing In Decision-Making And Data Analysis
Hypothesis testing is important because it helps us make smart choices and understand data better. Here’s why it’s useful:
- Reduces Guesswork : It helps us see if our guesses or ideas are likely correct, even when we don’t have all the details.
- Uses Real Data : Instead of just guessing, it checks if our ideas match up with real data, which makes our decisions more reliable.
- Avoids Errors : It helps us avoid mistakes by carefully checking if our ideas are right so we don’t make costly errors.
- Shows What to Do Next : It tells us if our ideas work or not, helping us decide whether to keep, change, or drop something. For example, a company might test a new ad and decide what to do based on the results.
- Confirms Research Findings : It makes sure that research results are accurate and not just random chance so that we can trust the findings.
Here’s a simple guide to understanding hypothesis testing, with an example:
1. Set Up Your Hypotheses
Explanation: Start by defining two statements:
- Null Hypothesis (H0): This is the idea that there is no change or effect. It’s what you assume is true.
- Alternative Hypothesis (H1): This is what you want to test. It suggests there is a change or effect.
Example: Suppose a company says their new batteries last an average of 500 hours. To check this:
- Null Hypothesis (H0): The average battery life is 500 hours.
- Alternative Hypothesis (H1): The average battery life is not 500 hours.
2. Choose the Test
Explanation: Pick a statistical test that fits your data and your hypotheses. Different tests are used for various kinds of data.
Example: Since you’re comparing the average battery life, you use a one-sample t-test .
3. Set the Significance Level
Explanation: Decide how much risk you’re willing to take if you make a wrong decision. This is called the significance level, often set at 0.05 or 5%.
Example: You choose a significance level of 0.05, meaning you’re okay with a 5% chance of being wrong.
4. Gather and Analyze Data
Explanation: Collect your data and perform the test. Calculate the test statistic to see how far your sample result is from what you assumed.
Example: You test 30 batteries and find they last an average of 485 hours. You then calculate how this average compares to the claimed 500 hours using the t-test.
5. Find the p-Value
Explanation: The p-value tells you the probability of getting a result as extreme as yours if the null hypothesis is true.
Example: You find a p-value of 0.0001. This means there’s a very small chance (0.01%) of getting an average battery life of 485 hours or less if the true average is 500 hours.
6. Make Your Decision
Explanation: Compare the p-value to your significance level. If the p-value is smaller, you reject the null hypothesis. If it’s larger, you do not reject it.
Example: Since 0.0001 is much less than 0.05, you reject the null hypothesis. This means the data suggests the average battery life is different from 500 hours.
7. Report Your Findings
Explanation: Summarize what the results mean. State whether you rejected the null hypothesis and what that implies.
Example: You conclude that the average battery life is likely different from 500 hours. This suggests the company’s claim might not be accurate.
Hypothesis testing is a way to use data to check if your guesses or assumptions are likely true. By following these steps—setting up your hypotheses, choosing the right test, deciding on a significance level, analyzing your data, finding the p-value, making a decision, and reporting results—you can determine if your data supports or challenges your initial idea.
Understanding Hypothesis Testing: A Simple Explanation
Hypothesis testing is a way to use data to make decisions. Here’s a straightforward guide:
1. What is the Null and Alternative Hypotheses?
- Null Hypothesis (H0): This is your starting assumption. It says that nothing has changed or that there is no effect. It’s what you assume to be true until your data shows otherwise. Example: If a company says their batteries last 500 hours, the null hypothesis is: “The average battery life is 500 hours.” This means you think the claim is correct unless you find evidence to prove otherwise.
- Alternative Hypothesis (H1): This is what you want to find out. It suggests that there is an effect or a difference. It’s what you are testing to see if it might be true. Example: To test the company’s claim, you might say: “The average battery life is not 500 hours.” This means you think the average battery life might be different from what the company says.
2. One-Tailed vs. Two-Tailed Tests
- One-Tailed Test: This test checks for an effect in only one direction. You use it when you’re only interested in finding out if something is either more or less than a specific value. Example: If you think the battery lasts longer than 500 hours, you would use a one-tailed test to see if the battery life is significantly more than 500 hours.
- Two-Tailed Test: This test checks for an effect in both directions. Use this when you want to see if something is different from a specific value, whether it’s more or less. Example: If you want to see if the battery life is different from 500 hours, whether it’s more or less, you would use a two-tailed test. This checks for any significant difference, regardless of the direction.
3. Common Misunderstandings
- Clarification: Hypothesis testing doesn’t prove that the null hypothesis is true. It just helps you decide if you should reject it. If there isn’t enough evidence against it, you don’t reject it, but that doesn’t mean it’s definitely true.
- Clarification: A small p-value shows that your data is unlikely if the null hypothesis is true. It suggests that the alternative hypothesis might be right, but it doesn’t prove the null hypothesis is false.
- Clarification: The significance level (alpha) is a set threshold, like 0.05, that helps you decide how much risk you’re willing to take for making a wrong decision. It should be chosen carefully, not randomly.
- Clarification: Hypothesis testing helps you make decisions based on data, but it doesn’t guarantee your results are correct. The quality of your data and the right choice of test affect how reliable your results are.
Benefits and Limitations of Hypothesis Testing
- Clear Decisions: Hypothesis testing helps you make clear decisions based on data. It shows whether the evidence supports or goes against your initial idea.
- Objective Analysis: It relies on data rather than personal opinions, so your decisions are based on facts rather than feelings.
- Concrete Numbers: You get specific numbers, like p-values, to understand how strong the evidence is against your idea.
- Control Risk: You can set a risk level (alpha level) to manage the chance of making an error, which helps avoid incorrect conclusions.
- Widely Used: It can be used in many areas, from science and business to social studies and engineering, making it a versatile tool.
Limitations
- Sample Size Matters: The results can be affected by the size of the sample. Small samples might give unreliable results, while large samples might find differences that aren’t meaningful in real life.
- Risk of Misinterpretation: A small p-value means the results are unlikely if the null hypothesis is true, but it doesn’t show how important the effect is.
- Needs Assumptions: Hypothesis testing requires certain conditions, like data being normally distributed . If these aren’t met, the results might not be accurate.
- Simple Decisions: It often results in a basic yes or no decision without giving detailed information about the size or impact of the effect.
- Can Be Misused: Sometimes, people misuse hypothesis testing, tweaking data to get a desired result or focusing only on whether the result is statistically significant.
- No Absolute Proof: Hypothesis testing doesn’t prove that your hypothesis is true. It only helps you decide if there’s enough evidence to reject the null hypothesis, so the conclusions are based on likelihood, not certainty.
Final Thoughts
Hypothesis testing helps you make decisions based on data. It involves setting up your initial idea, picking a significance level, doing the test, and looking at the results. By following these steps, you can make sure your conclusions are based on solid information, not just guesses.
This approach lets you see if the evidence supports or contradicts your initial idea, helping you make better decisions. But remember that hypothesis testing isn’t perfect. Things like sample size and assumptions can affect the results, so it’s important to be aware of these limitations.
In simple terms, using a step-by-step guide for hypothesis testing is a great way to better understand your data. Follow the steps carefully and keep in mind the method’s limits.
What is the difference between one-tailed and two-tailed tests?
A one-tailed test assesses the probability of the observed data in one direction (either greater than or less than a certain value). In contrast, a two-tailed test looks at both directions (greater than and less than) to detect any significant deviation from the null hypothesis.
How do you choose the appropriate test for hypothesis testing?
The choice of test depends on the type of data you have and the hypotheses you are testing. Common tests include t-tests, chi-square tests, and ANOVA. You get more details about ANOVA, you may read Complete Details on What is ANOVA in Statistics ? It’s important to match the test to the data characteristics and the research question.
What is the role of sample size in hypothesis testing?
Sample size affects the reliability of hypothesis testing. Larger samples provide more reliable estimates and can detect smaller effects, while smaller samples may lead to less accurate results and reduced power.
Can hypothesis testing prove that a hypothesis is true?
Hypothesis testing cannot prove that a hypothesis is true. It can only provide evidence to support or reject the null hypothesis. A result can indicate whether the data is consistent with the null hypothesis or not, but it does not prove the alternative hypothesis with certainty.
Related Posts

How to Find the Best Online Statistics Homework Help

Why SPSS Homework Help Is An Important aspect for Students?
Leave a comment cancel reply.
Your email address will not be published. Required fields are marked *
IMAGES
VIDEO
COMMENTS
hypothesis: meaning, types and formulation
Definition: Hypothesis is an educated guess or proposed explanation for a phenomenon, based on some initial observations or data. It is a tentative statement that can be tested and potentially proven or disproven through further investigation and experimentation. Hypothesis is often used in scientific research to guide the design of experiments ...
Complex Hypothesis Examples. A complex hypothesis involves more than two variables. An example could be, "If students sleep for at least 8 hours and eat a healthy breakfast, then their test scores and overall well-being will improve." This type of hypothesis examines multiple factors and their combined effects.
Research Hypothesis: Definition, Types, Examples and ...
Key Takeaways. A hypothesis is a prediction that guides the research process. Formulating a hypothesis helps focus data collection and analysis. Background research is essential for developing a good hypothesis. There are different types of hypotheses, like null and alternative. Ethical considerations are important when making a hypothesis.
A hypothesis offers a clear direction for research and helps focus the study. Formulating a hypothesis involves investigating background research, forming a theory, and testing it. There are different types of hypotheses, including null, alternative, directional, and non-directional. A good hypothesis should be testable, clear, precise, and ...
How to Write a Strong Hypothesis | Steps & Examples
A hypothesis is a prediction of what will be found at the outcome of a research project and is typically focused on the relationship between two different variables studied in the research. It is usually based on both theoretical expectations about how things work and already existing scientific evidence. Within social science, a hypothesis can ...
Hypothesis: Definition, Examples, and Types
Scientific hypothesis | Definition, Formulation, & Example
What is a research hypothesis: How to write it, types, and ...
Research Hypothesis: What It Is, Types How to Develop?
Research Hypothesis In Psychology: Types, & Examples
4 Alternative hypothesis. An alternative hypothesis, abbreviated as H 1 or H A, is used in conjunction with a null hypothesis. It states the opposite of the null hypothesis, so that one and only one must be true. Examples: Plants grow better with bottled water than tap water. Professional psychics win the lottery more than other people. 5 ...
Abstract. A hypothesis is a logical construct, interposed between a problem and its solution, which represents a proposed answer to a research question. It gives direction to the investigator's thinking about the problem and, therefore, facilitates a solution. There are three primary modes of inference by which hypotheses are developed ...
The hypothesis is a predictive, testable statement predicting the outcome and the results the researcher expects to find. The hypothesis provides a summary of what direction, if any, is taken to investigate a theory. In scientific research, there is a criterion that hypotheses need to be met to be regarded as acceptable.
Hypothesis Testing | A Step-by-Step Guide with Easy ...
Theories and Hypotheses. Before describing how to develop a hypothesis, it is important to distinguish between a theory and a hypothesis. A theory is a coherent explanation or interpretation of one or more phenomena. Although theories can take a variety of forms, one thing they have in common is that they go beyond the phenomena they explain by including variables, structures, processes ...
There are three major difficulties in the formulation of a hypothesis, they are as follows: Absence of a clear theoretical framework. Lack of ability to utilize that theoretical framework logically. Failure to be acquainted with available research techniques so as to phrase the hypothesis properly. Sometimes the deduction of a hypothesis may be ...
Types of Research Questions; 5. Examples of Research Questions for Program Evaluation; 6. Research Hypothesis; 7. Null Hypothesis; 8. Hypotheses and Program Evaluation; 9. ... Interval; 13.4. Ratio; 14. Reasons for Differentiating Between Levels of Measurement; Title Slide. Hypotheses, Conceptualization, Operationalization and Levels of ...
At the primary level, a hypothesis is the possible and probable explanation of the sequence of happenings or data. Sometimes, hypothesis may emerge from an imagination, common sense or a sudden event. Hypothesis can be a probable answer to the research problem undertaken for study. 4. Hypothesis may not always be true.
Simply put, hypothesis testing is a way to use data to help make decisions and understand what the data is really telling us, even when we don't have all the answers. Importance Of Hypothesis Testing In Decision-Making And Data Analysis. Hypothesis testing is important because it helps us make smart choices and understand data better.